Upstream: a safety board of inputs people control
Concept Specified and mocked up, not yet deployed. Every plant, person, and figure in the screens is fictional.
- Role
- Concept and interface design
- Year
- 2026
- Tools
- Concept deckInterface mock-ups
Overview
Replaces the days-since-last-injury sign with six inputs people control, counted against targets by shift and area. Incidents are a line, never a headline.
Problem
The “days since last injury” sign measures luck.
Everything on it is decided by what already happened, and nothing on it is something a person can do today. Operators, leads, and supervisors cannot act on the sign; they can only hope it keeps counting. When the count is the headline, reporting a strain or a near miss resets the plant’s score, so people learn not to. And a reset erases the work in between: the hazards found, the checks done, the walks logged.
Approach
Replace the sign with six inputs people control, and carry incidents honestly as a line underneath.
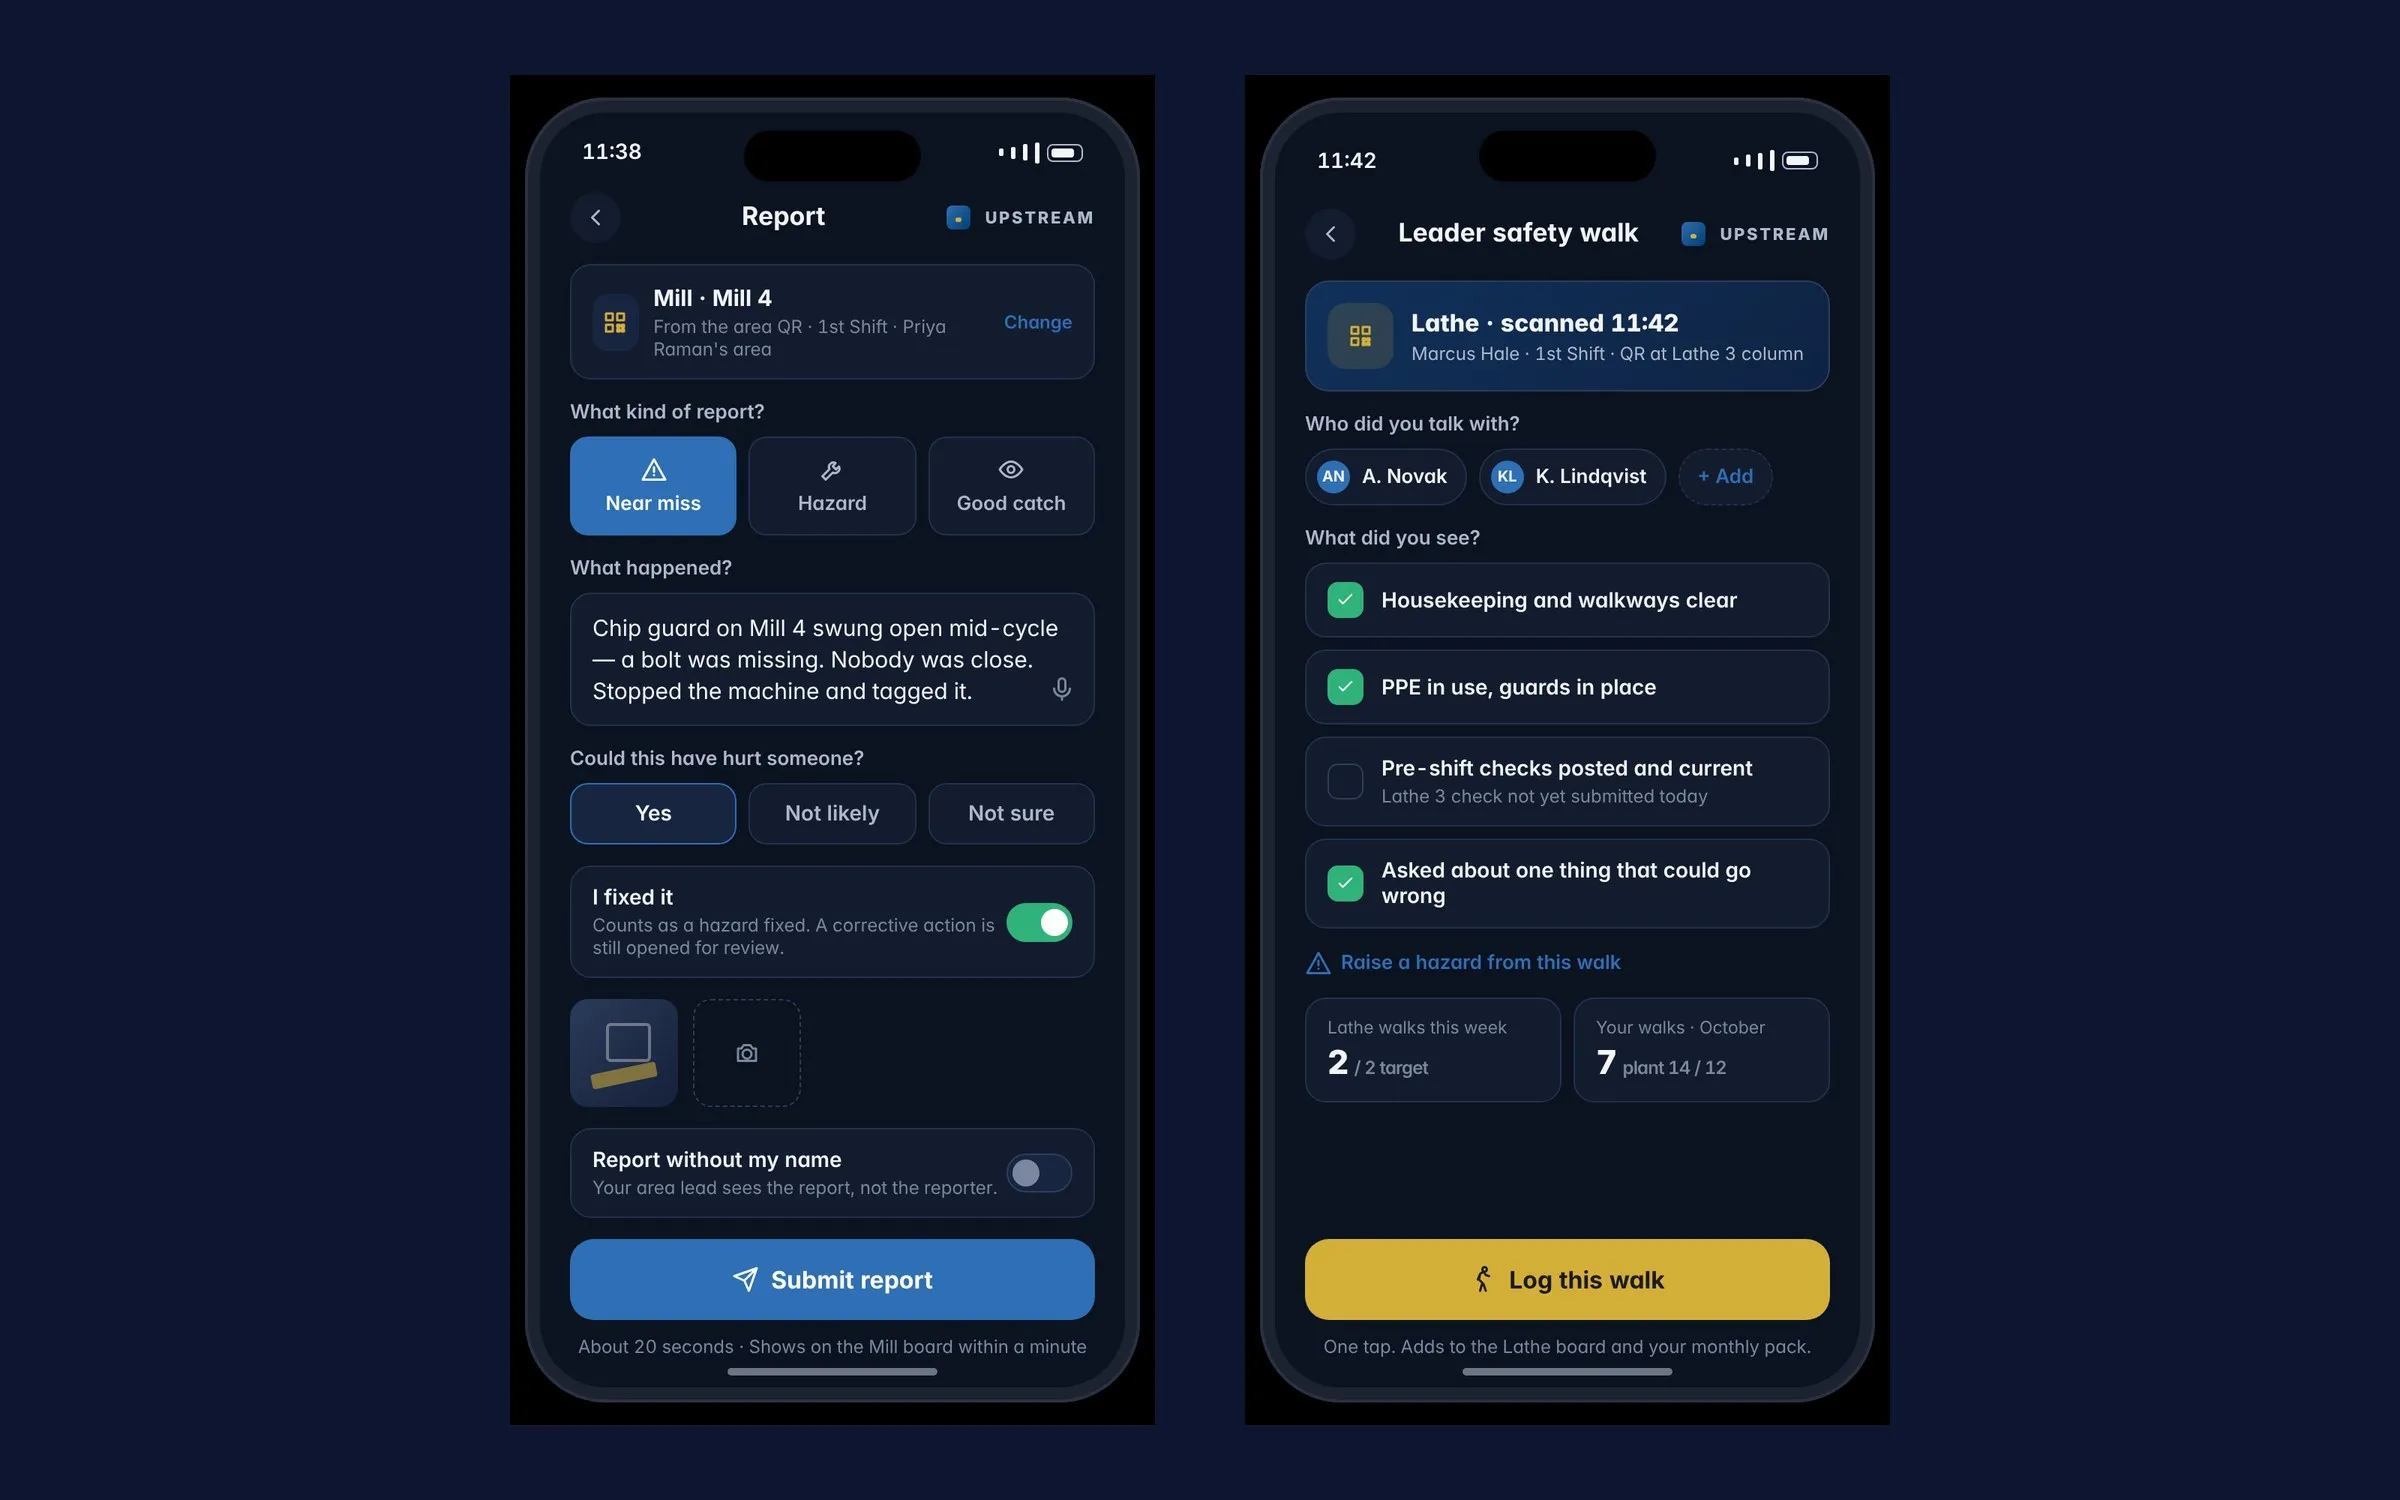
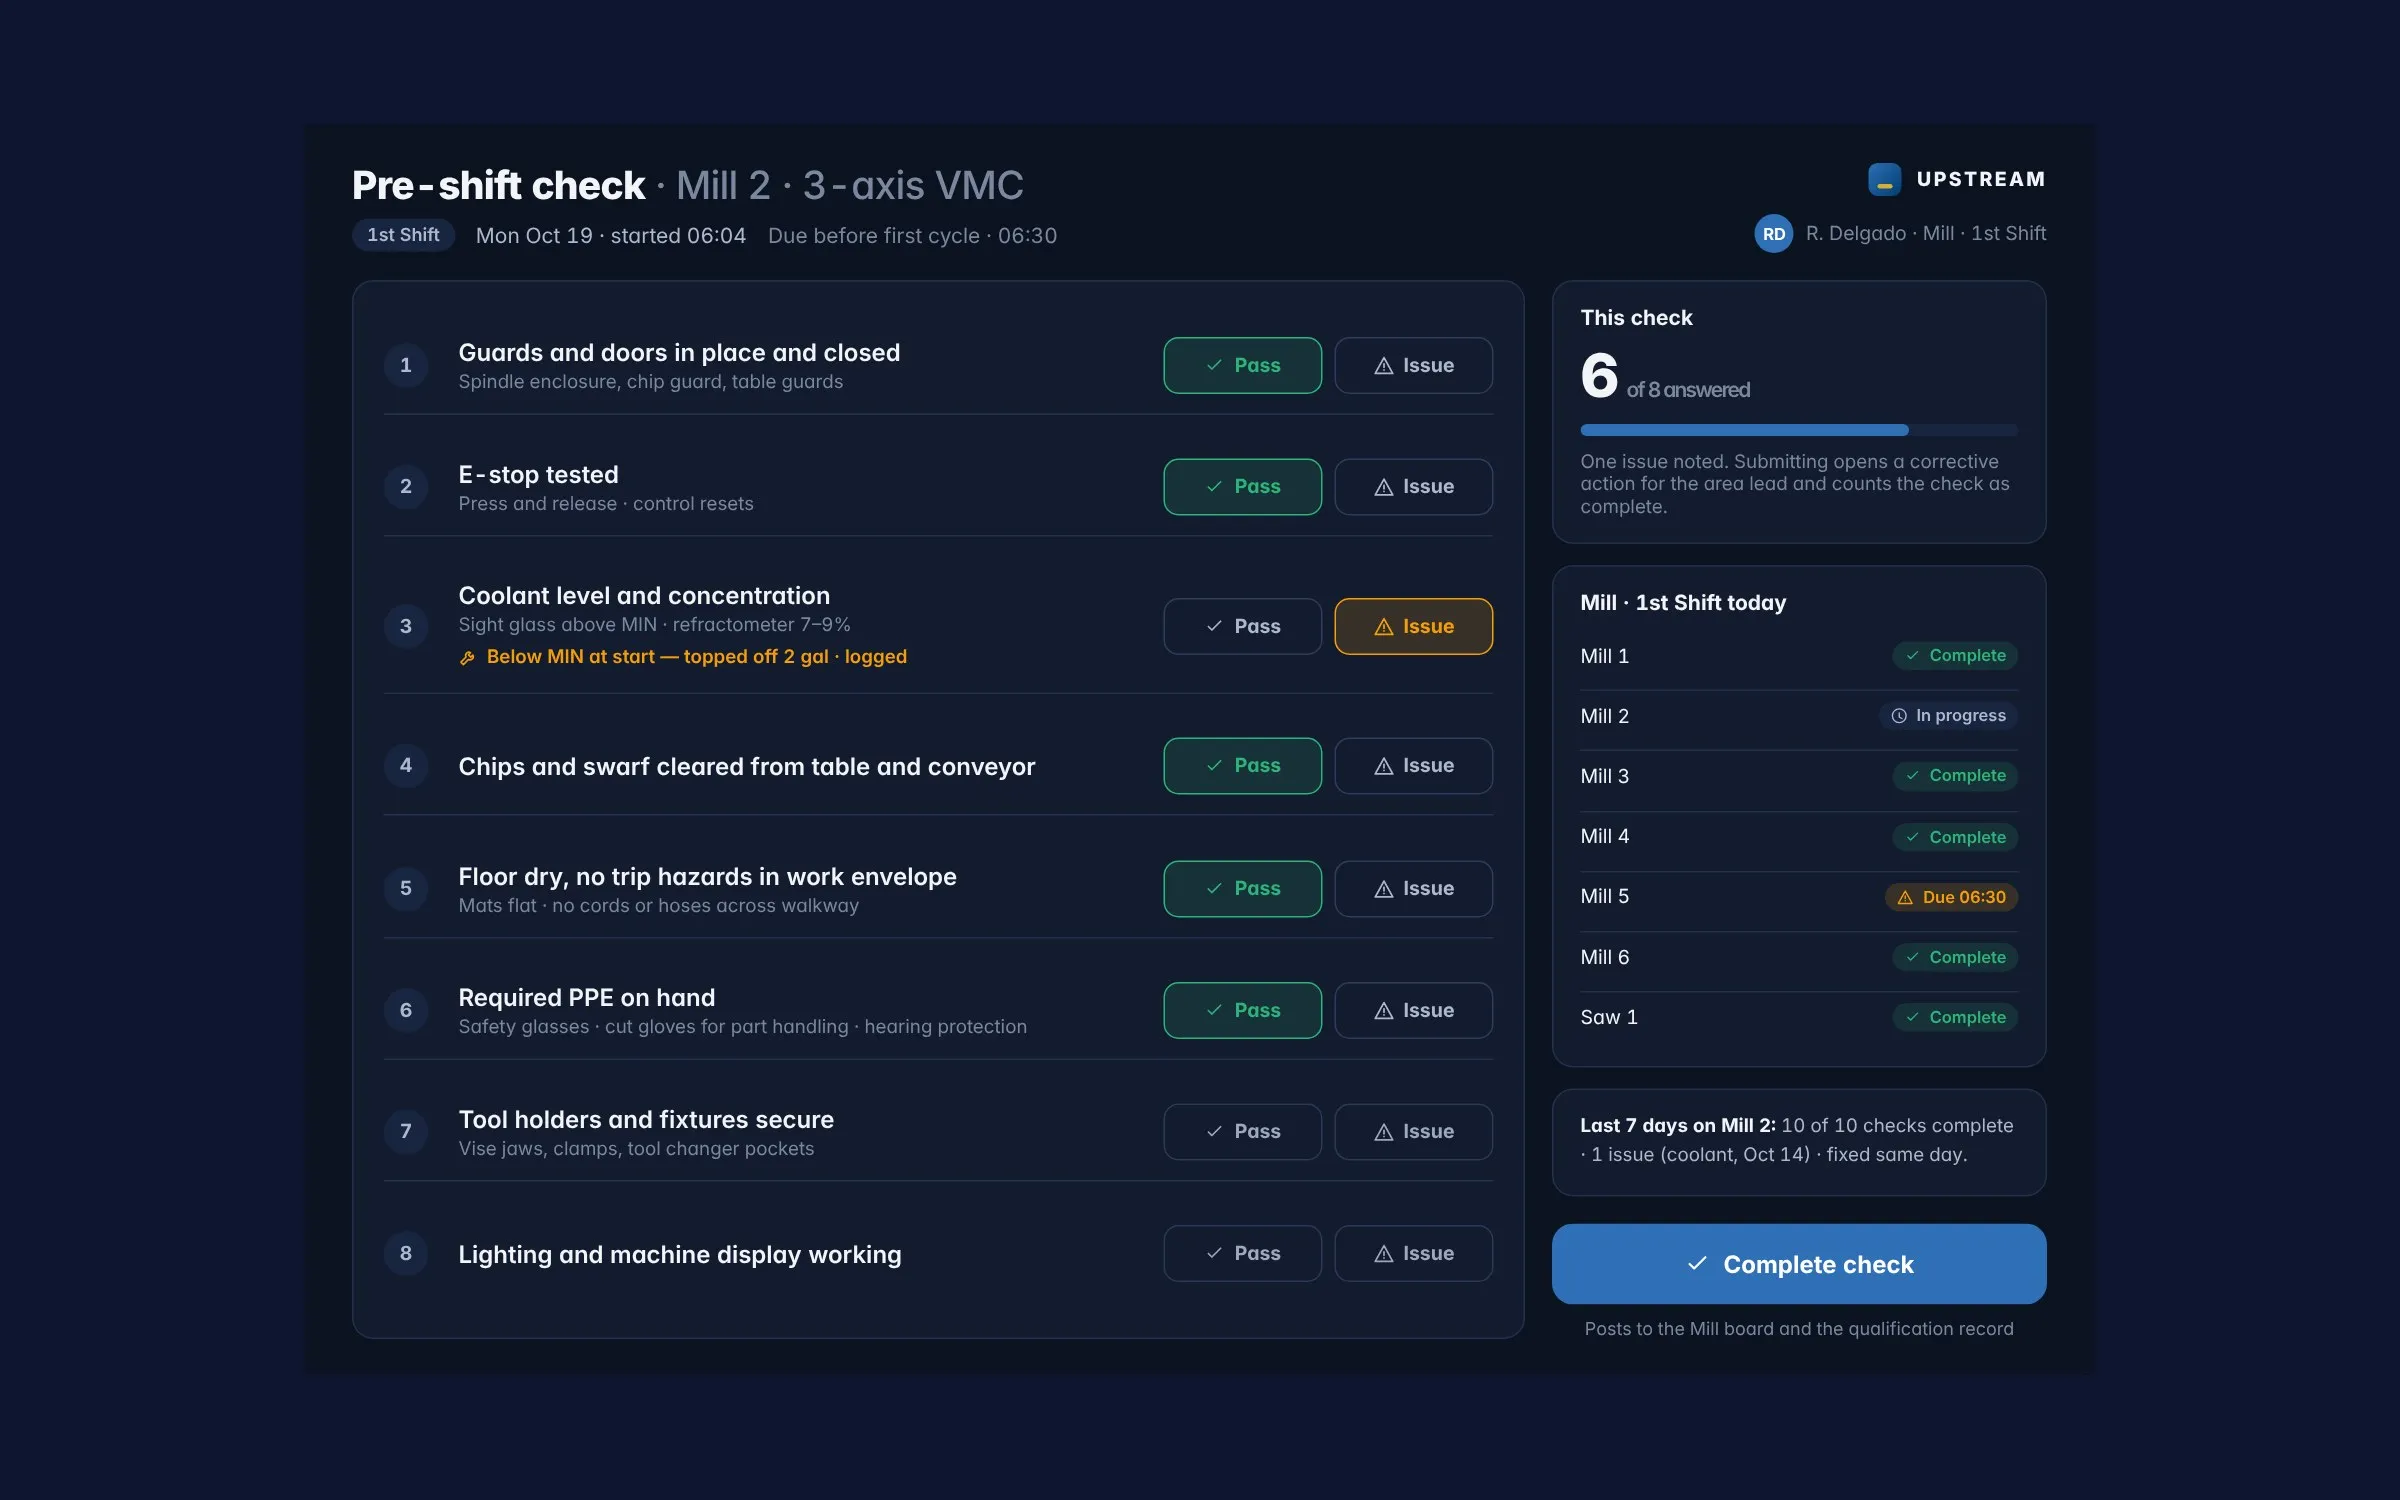
Near misses reported, hazards fixed, pre-shift checks completed, audits done, training current, and leader safety walks logged. Each comes from work people already do, through the reporter, the machine checks, the audit log, the qualification matrix, and a one-tap walk log behind the area’s QR code. Leading activities are the discretionary acts, counted against a participation target set per area from headcount; checks and training are shown as completion rates so routine compliance does not swamp them.
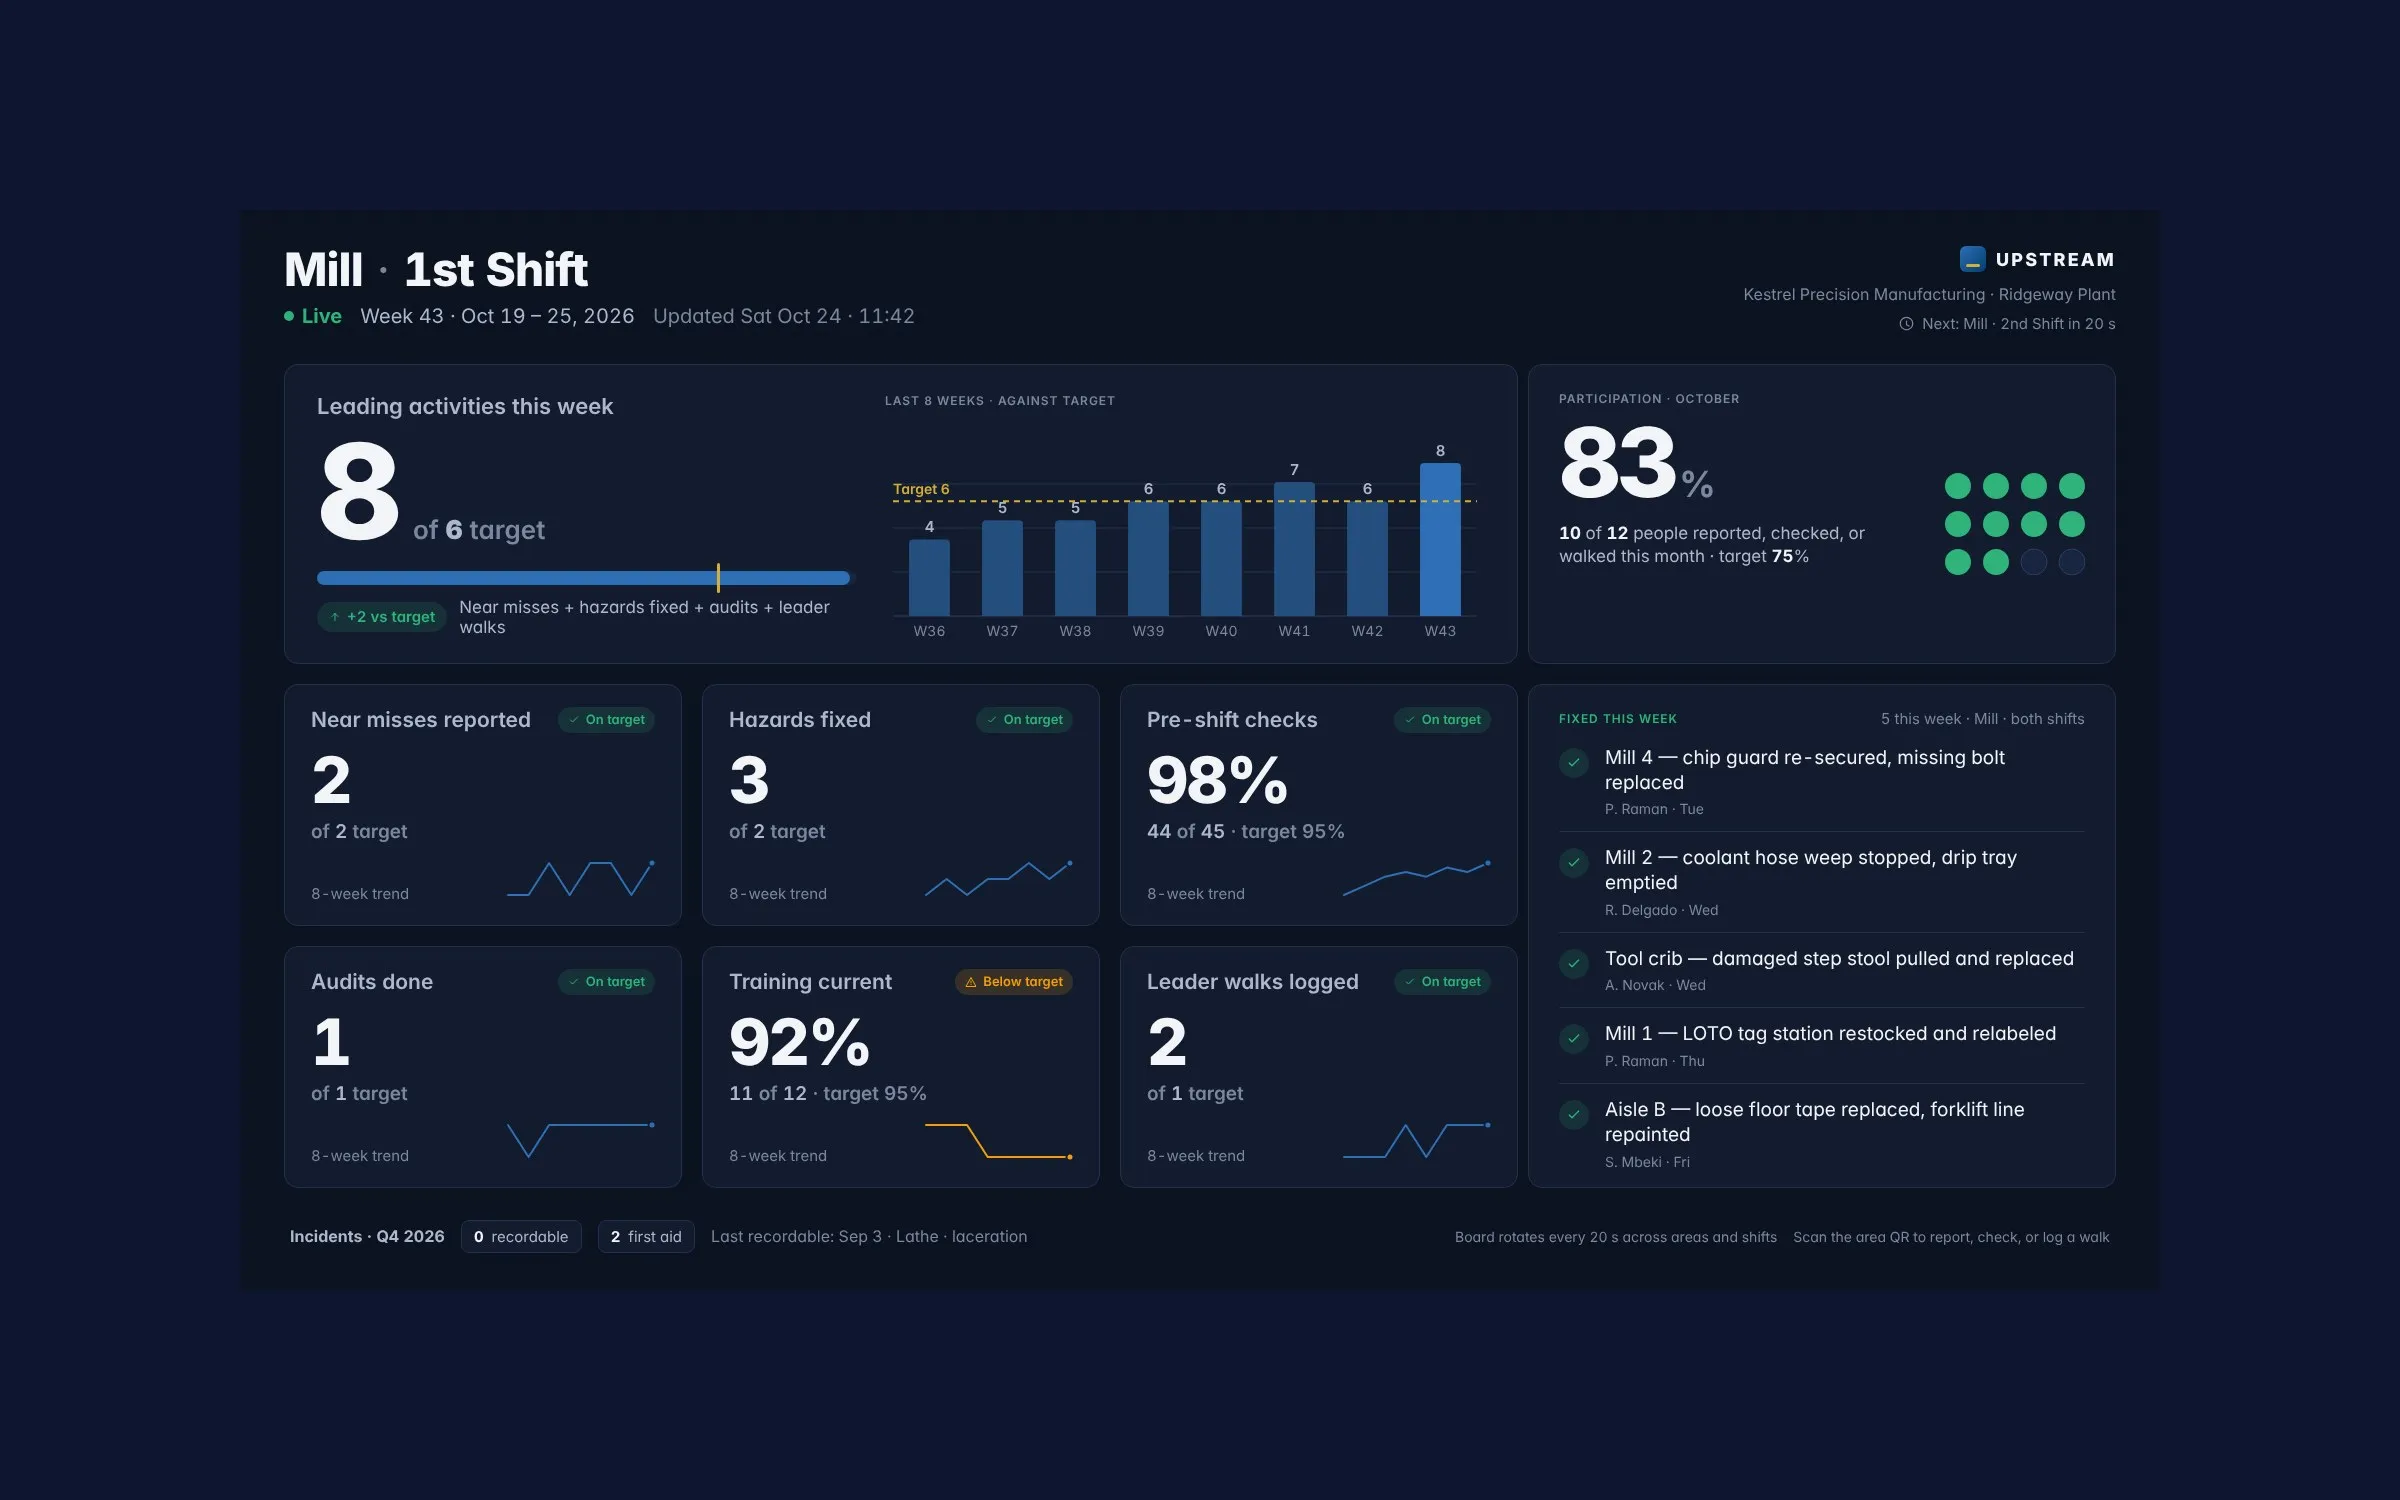
One board per area rotates by shift on the floor TV: this week against target, an eight-week trend, the six inputs with their status, participation this month, and “fixed this week” with names and dates, because the board gives credit for closing things. Incidents appear as a small factual line at the bottom. There is never a zero-incident target, a streak, or a countdown, because a target of zero drives hiding and reporting is the goal.
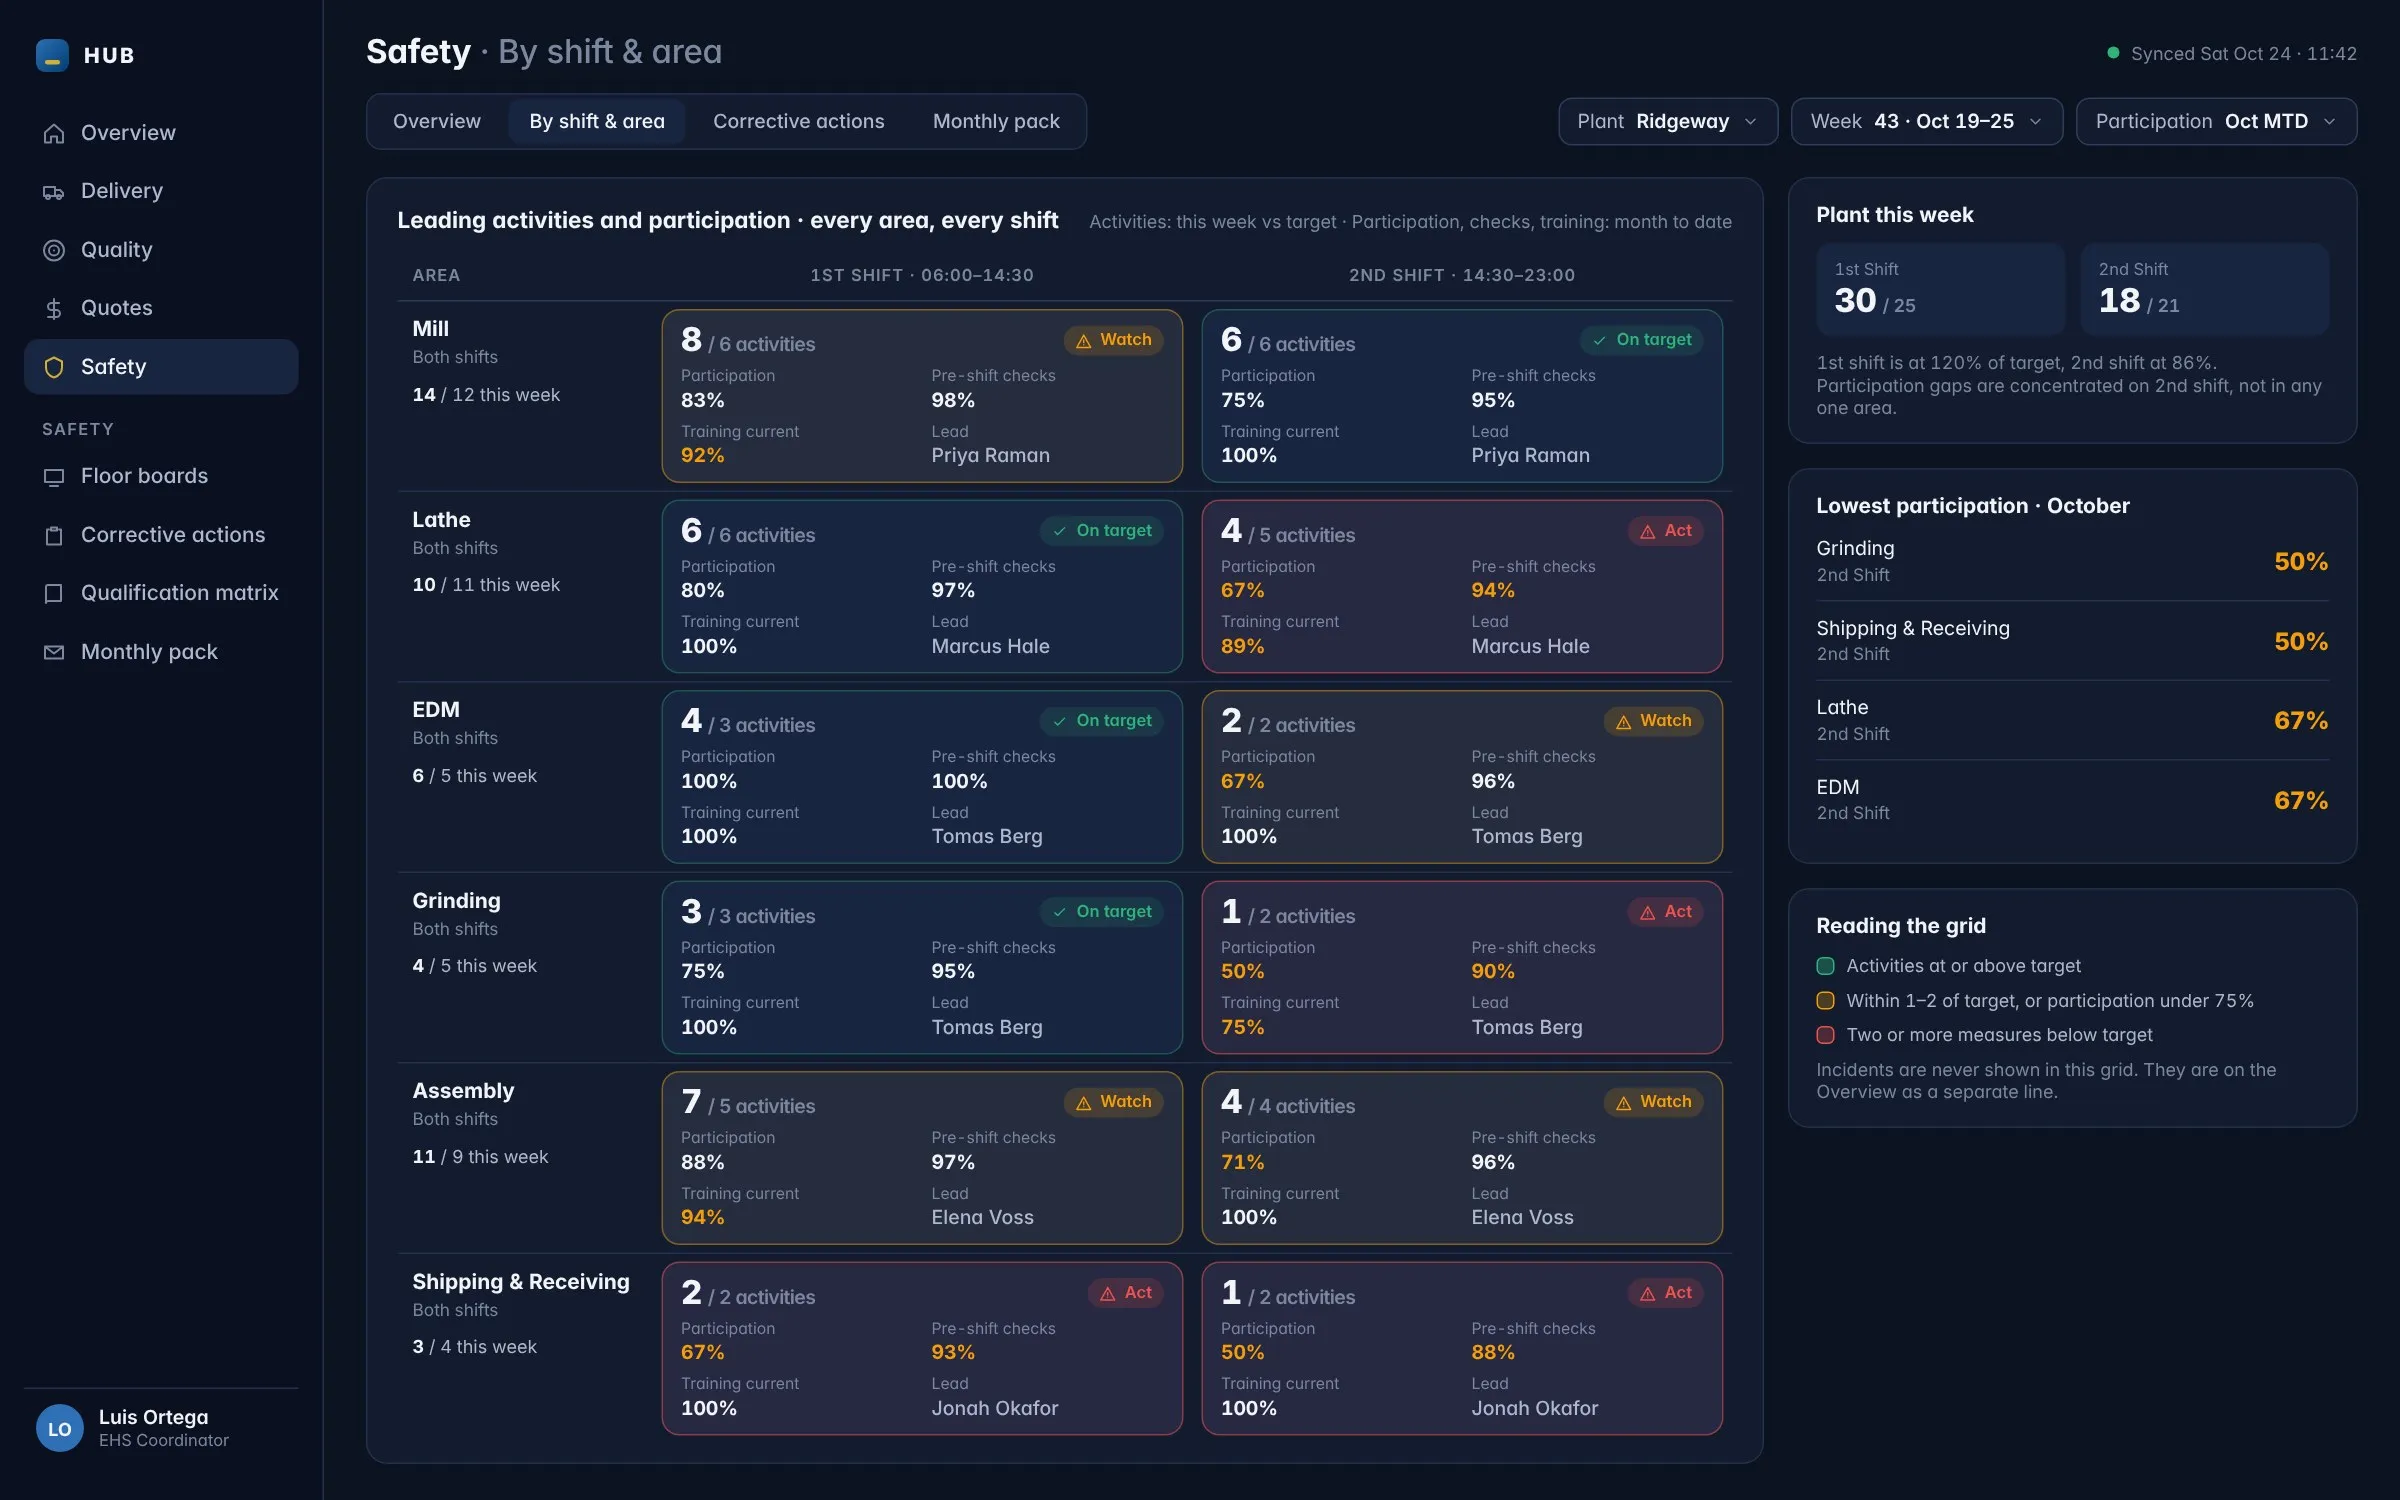
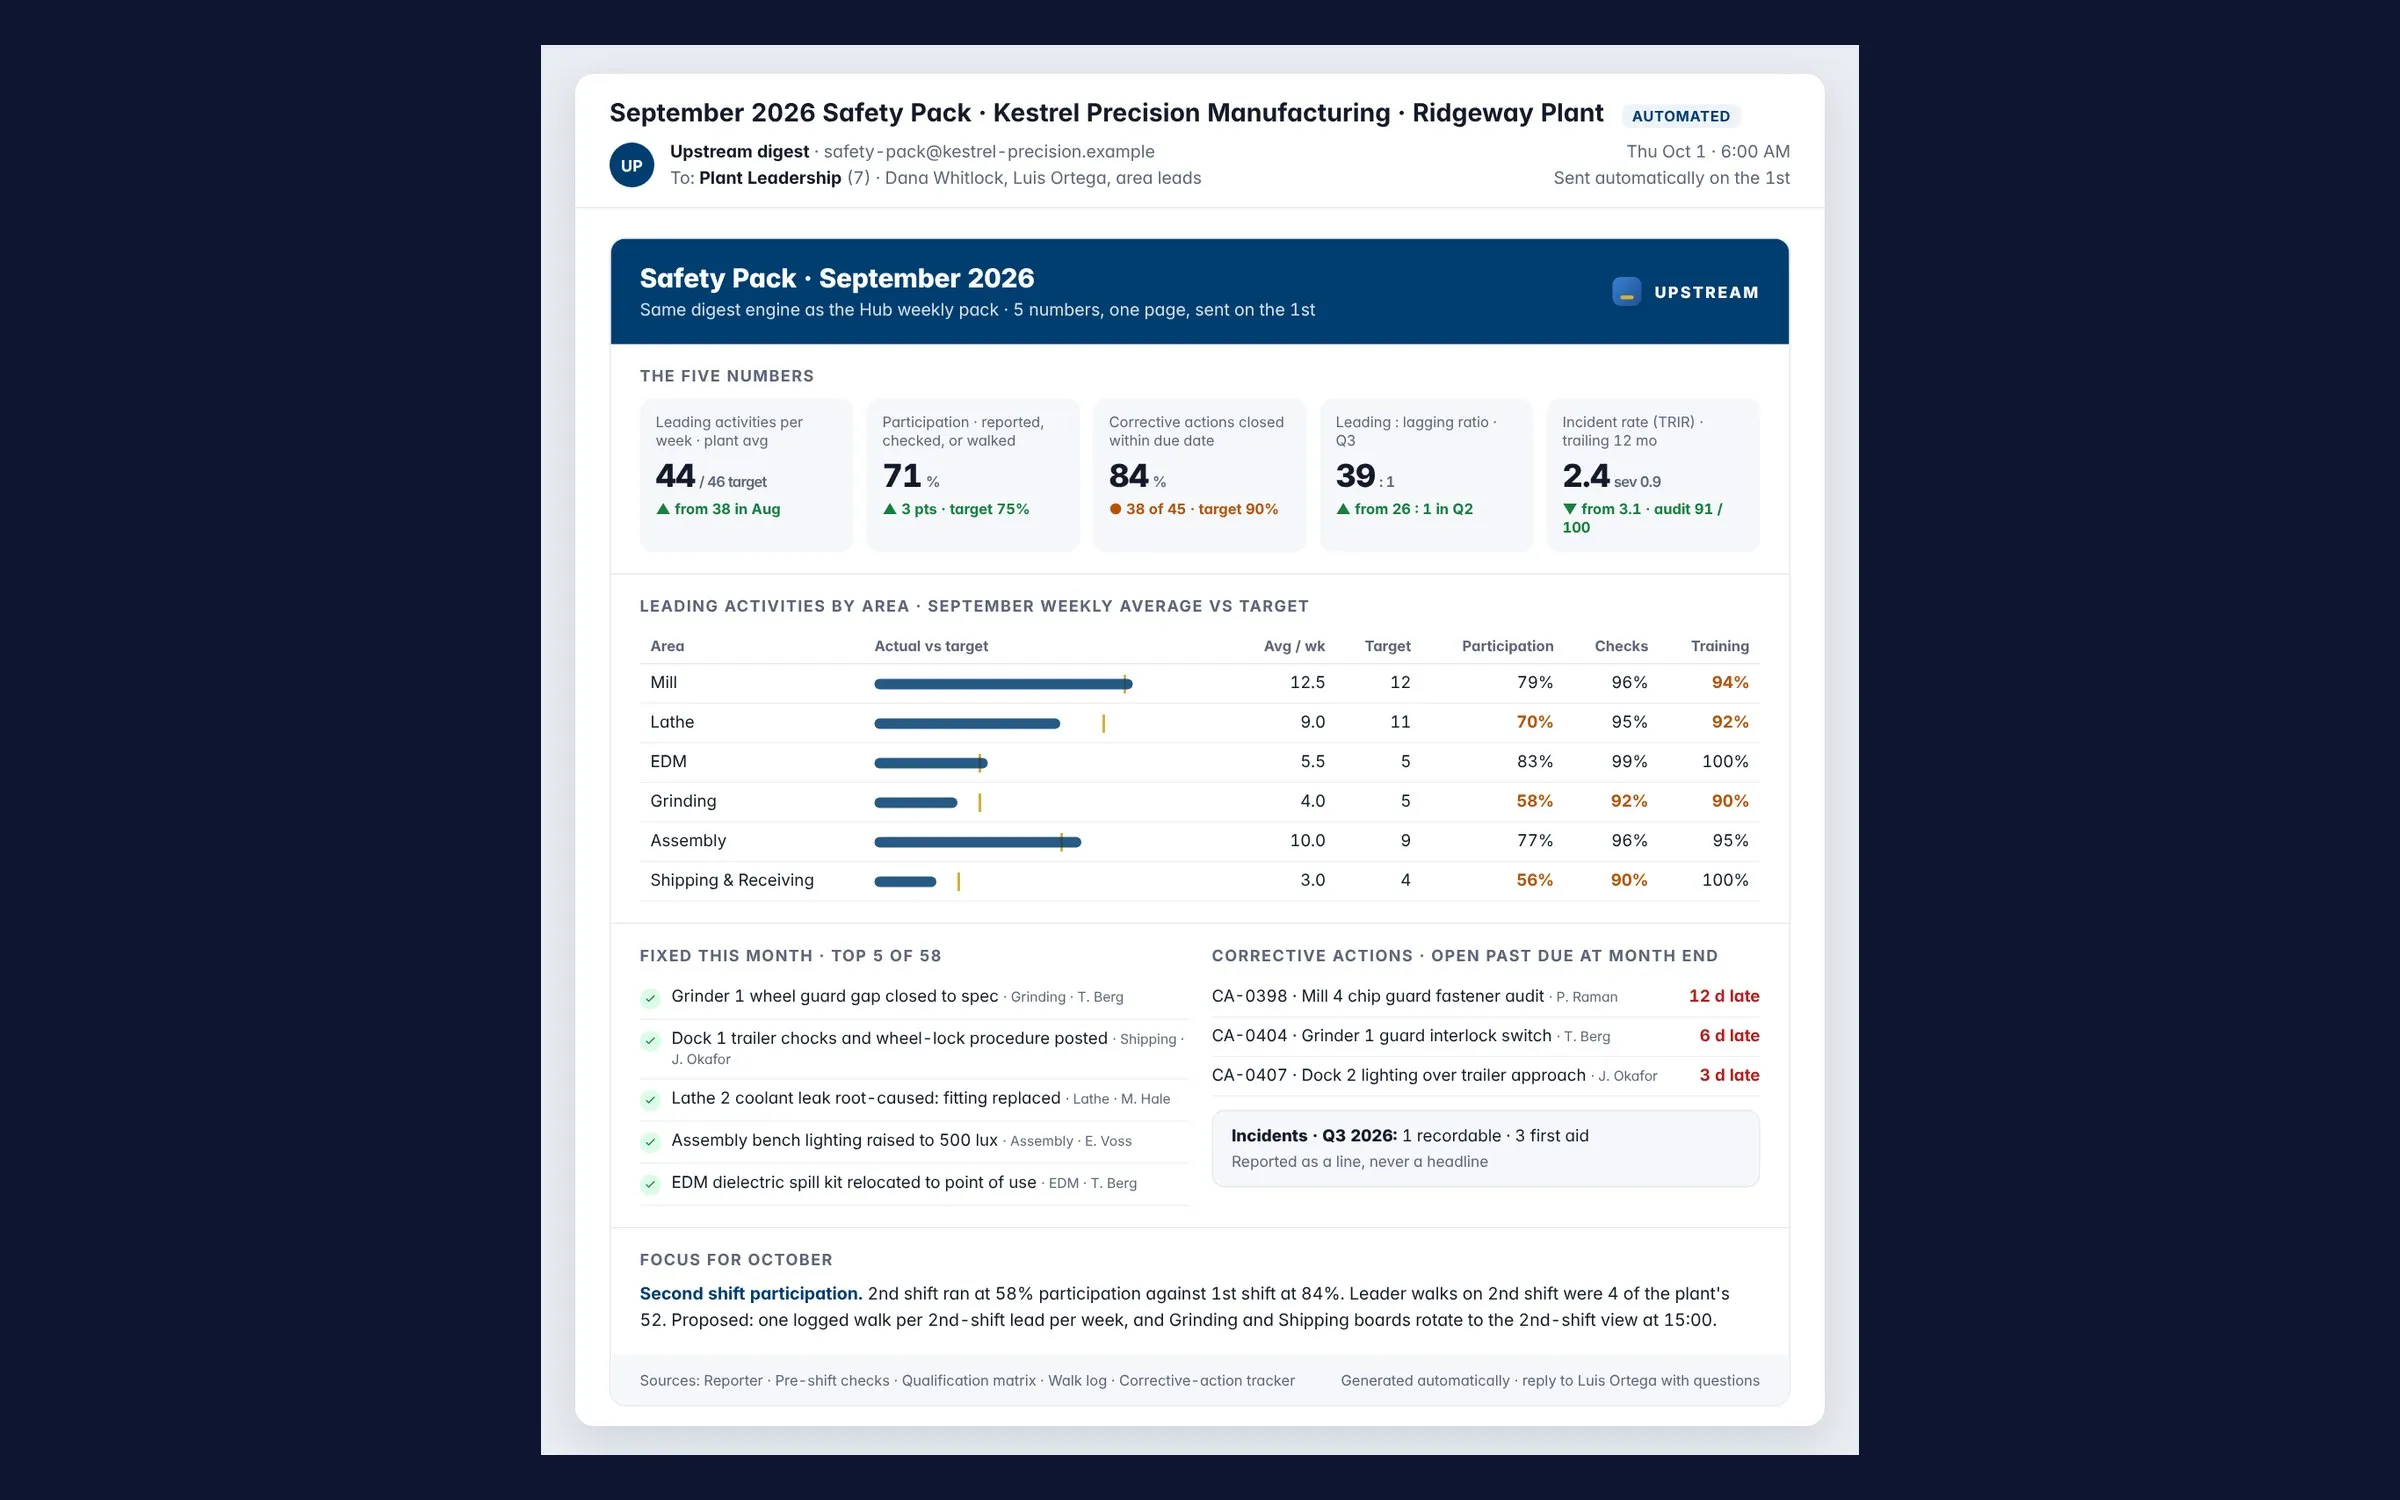
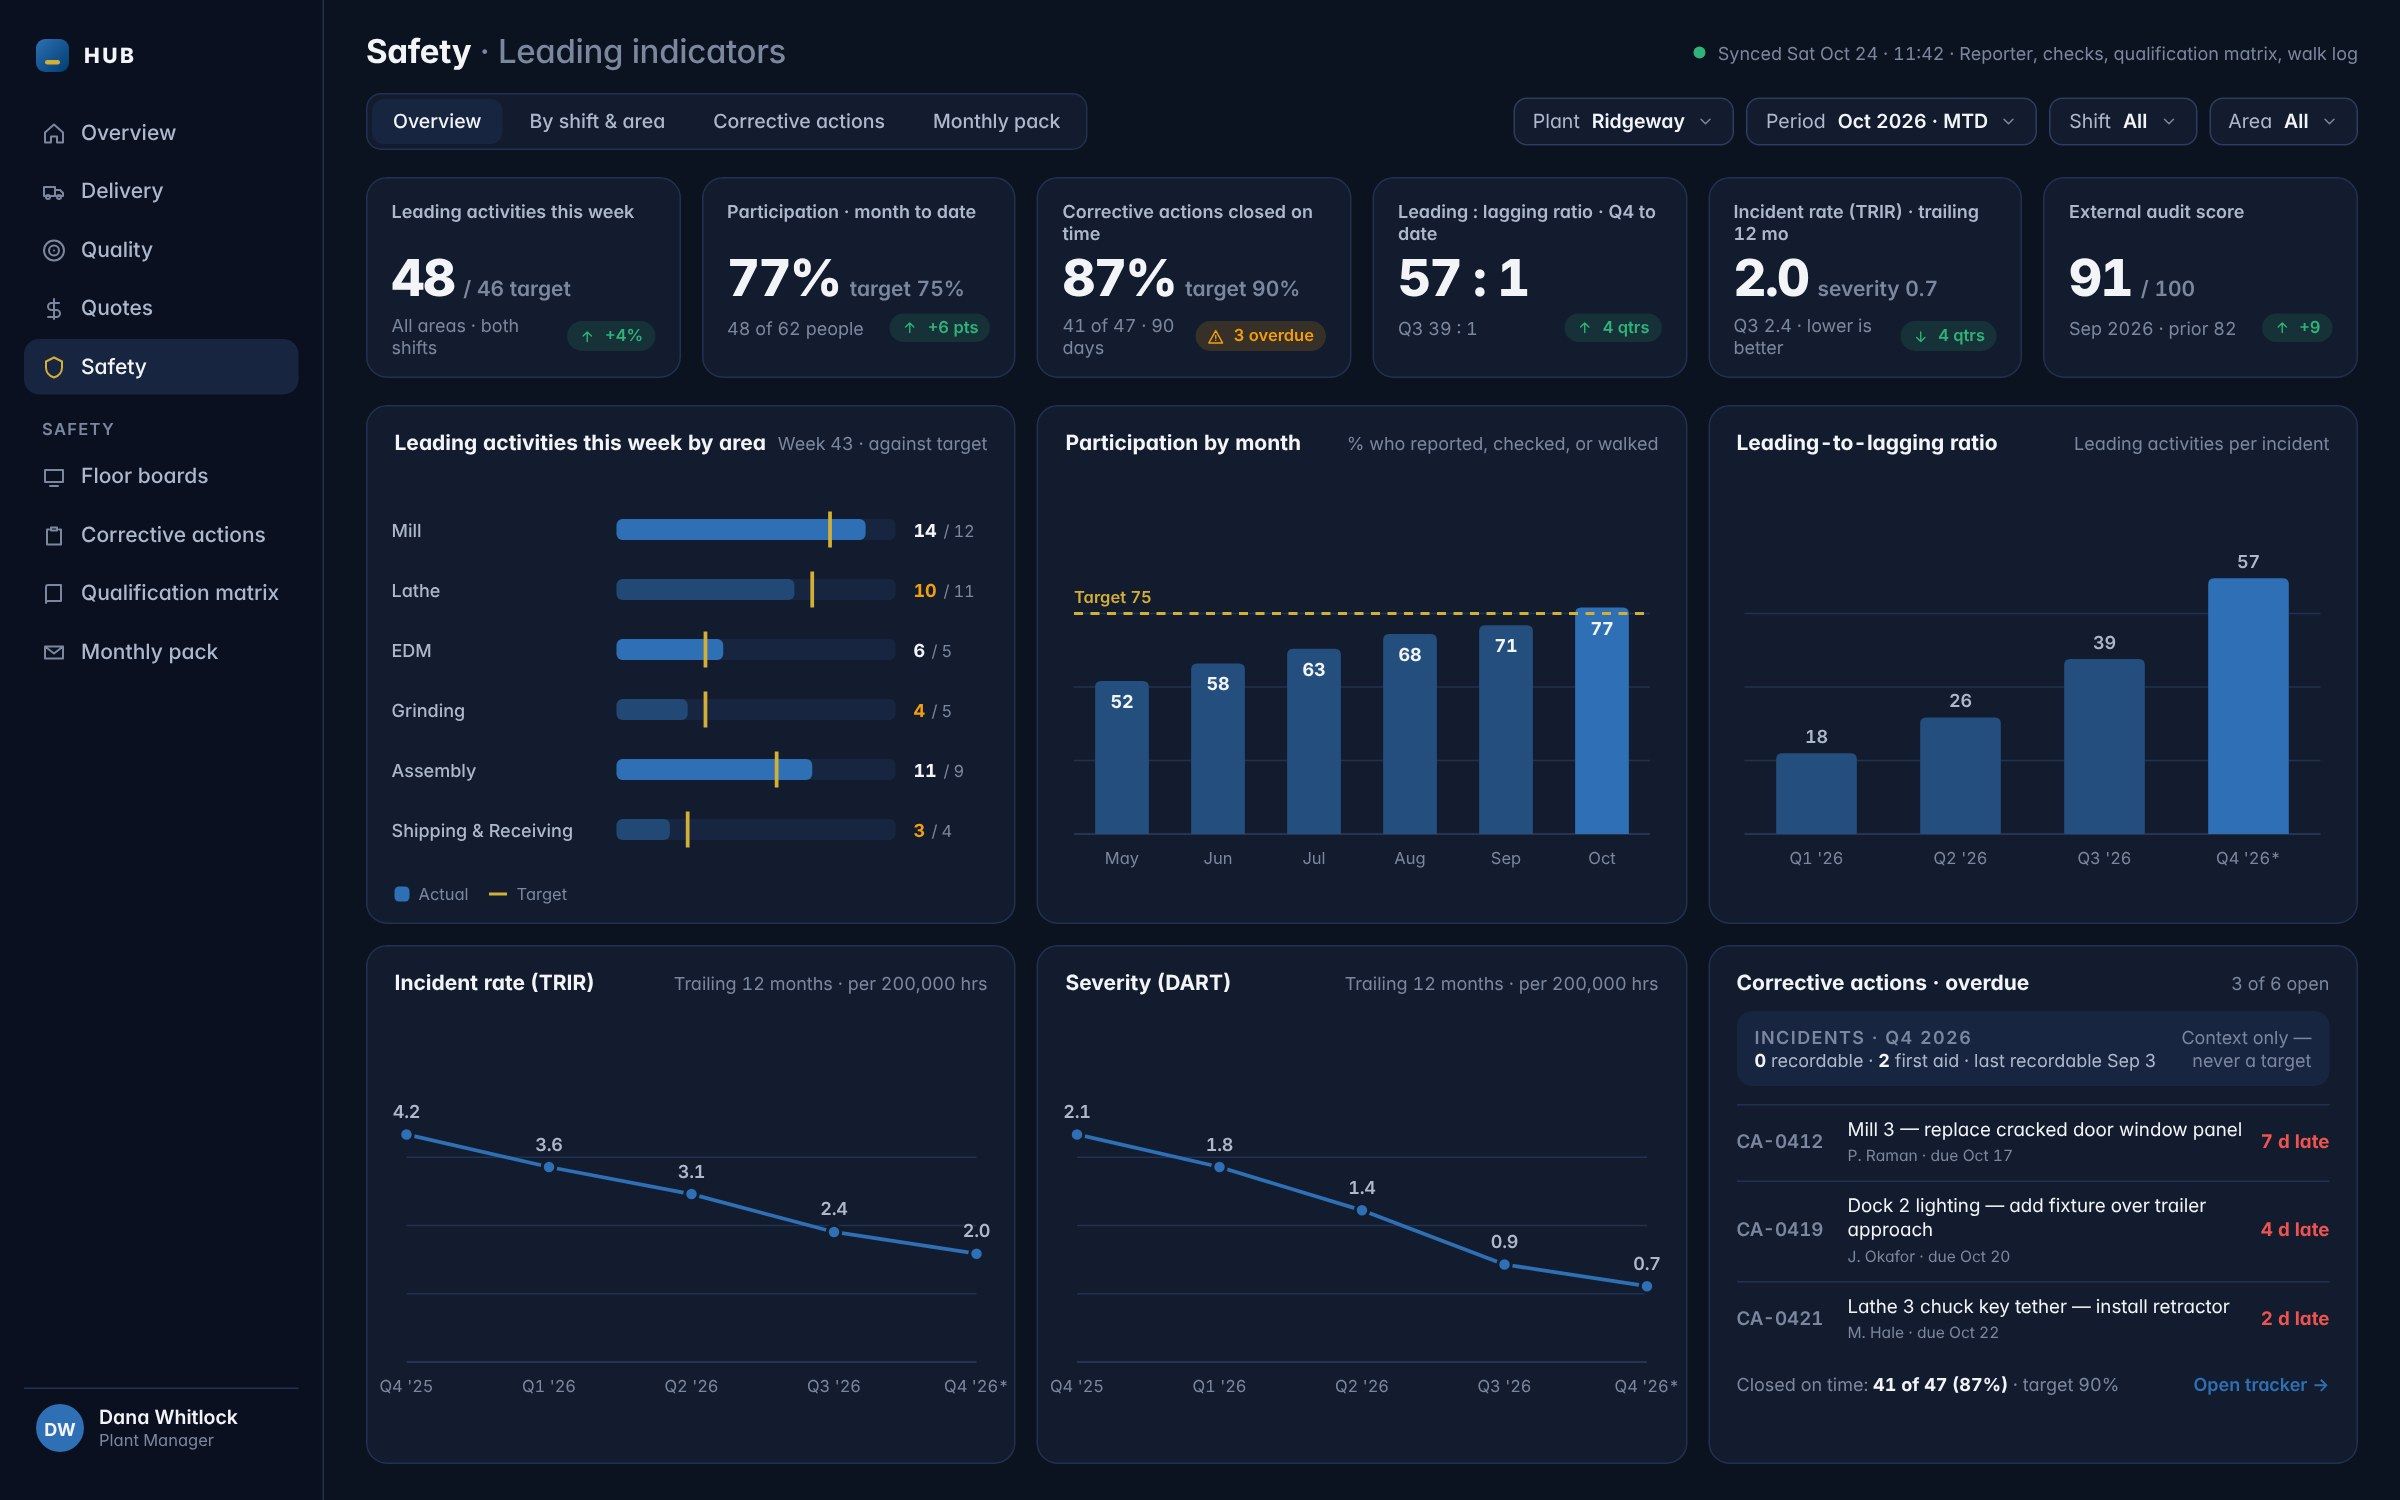
Leadership sees every area and every shift on one screen with status by rule, so a gap shows itself as a staffing question when second shift is short across areas rather than one area across shifts. A monthly pack goes out on the first with five numbers on one page, the overdue corrective actions by owner, and one proposed focus for next month written from the data.
Outcome
| Metric | Result |
|---|---|
| Status | Concept, in development |
| Inputs | Six, from work people already do |
| Headline | Leading activities against target |
| Incidents | A line on the board, never a target |
Built to move five measures, each with a stated direction.
Leading activities per week by area, up to target. Participation, the share of people who reported, checked, or walked this month, up. Corrective actions closed within their due date, up. The leading-to-lagging ratio, activities per incident, rising every quarter; the slope matters more than the level. Incident rate and severity down over quarters, with the external audit score improving, read quarterly and never as a floor headline.
Nothing here has run on a floor yet. The screens are a specification with fictional data, and the numbers on them are placeholders.
Gallery
-
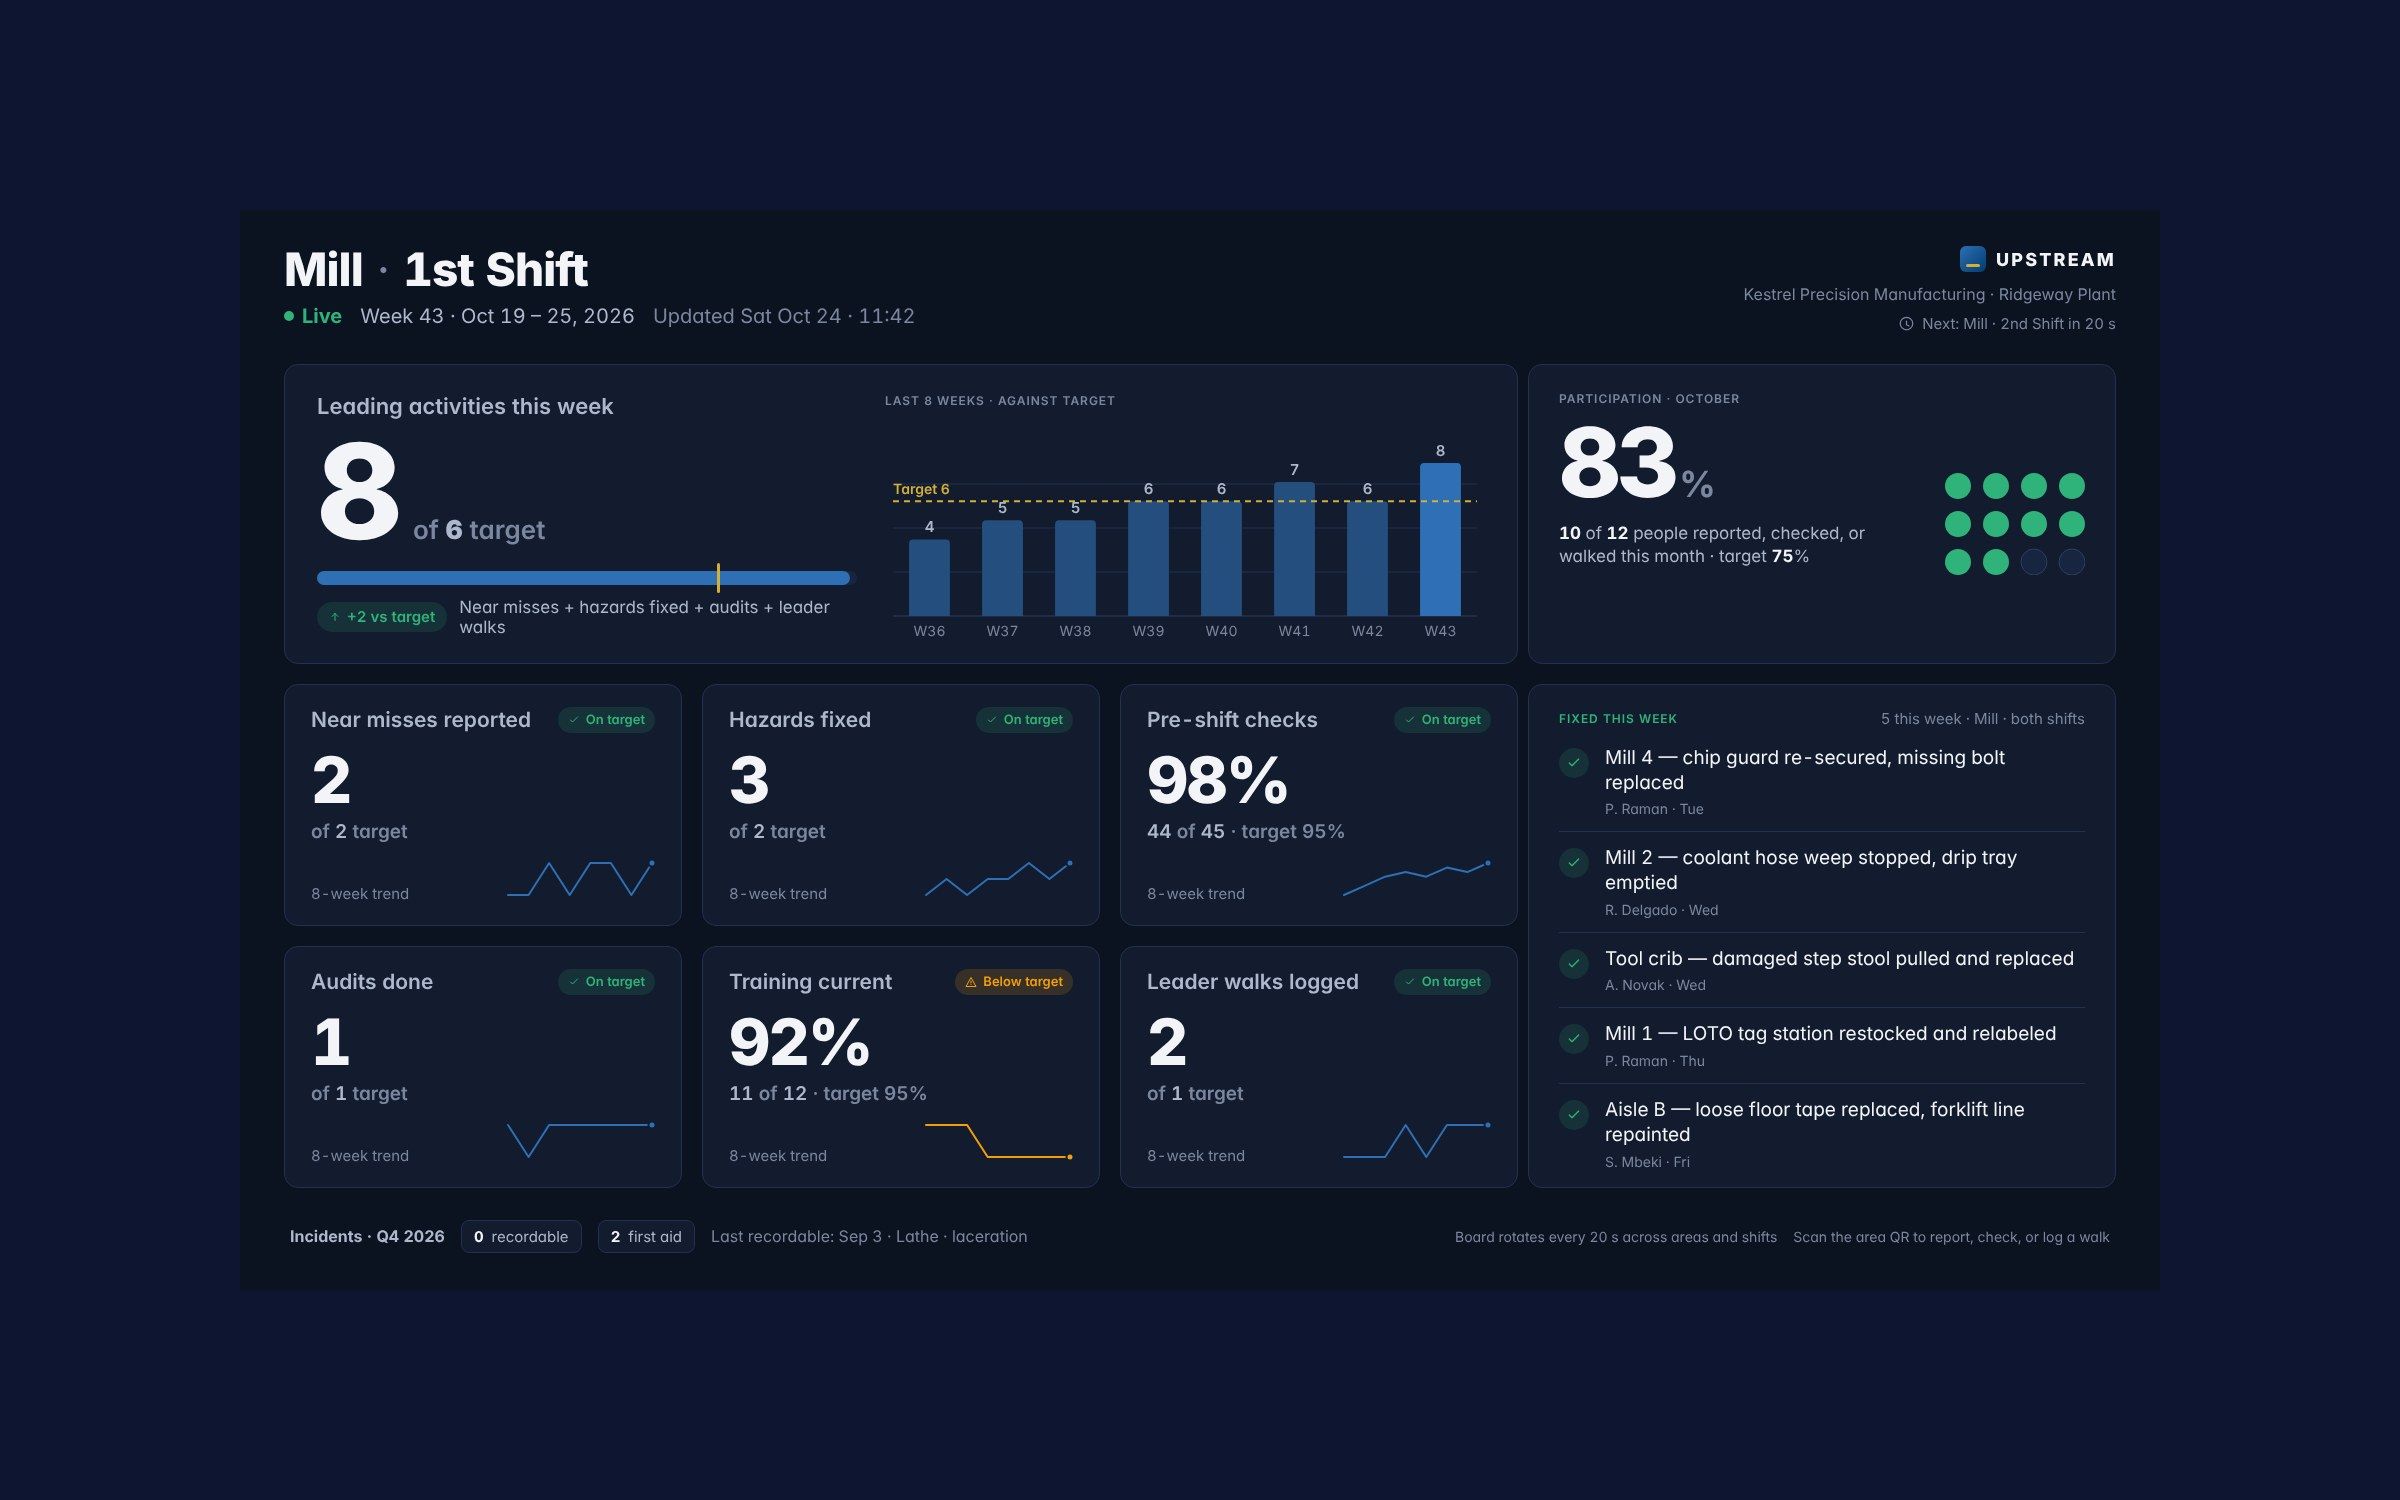
4.0 This week against target, by shift and area, rotating on the floor TV. Image -
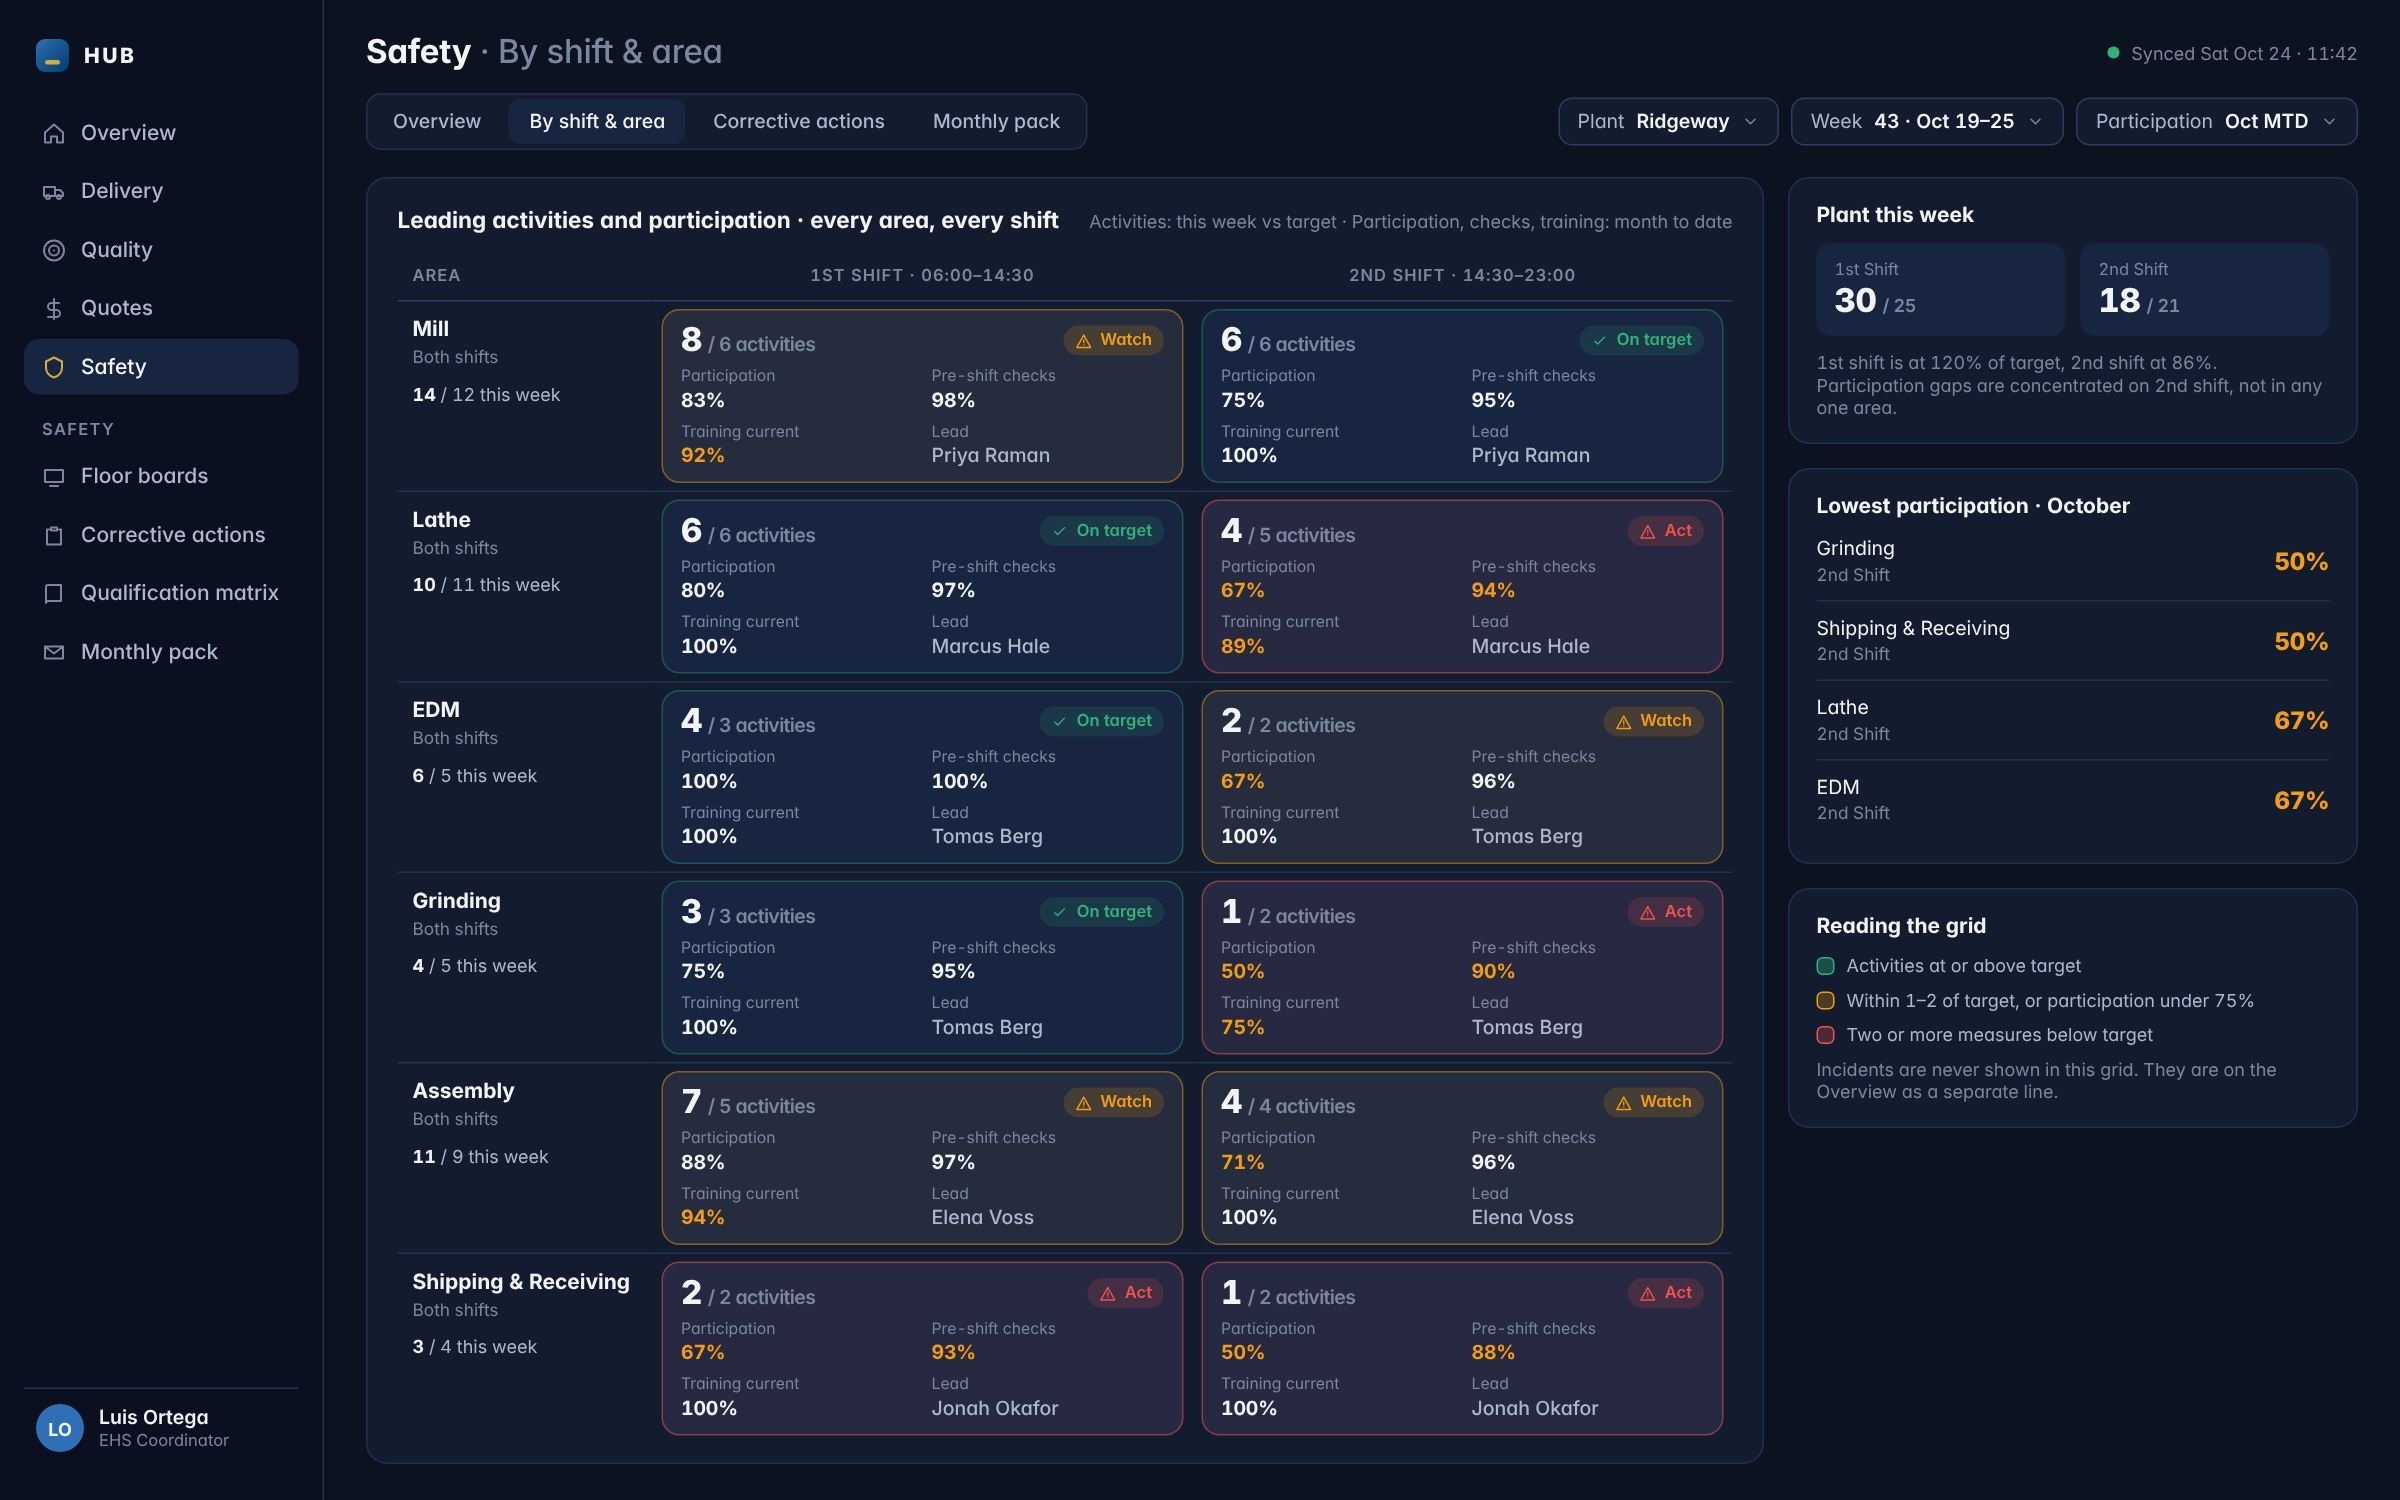
4.1 Second shift short across every area is a leadership question, not a machine question. Image -
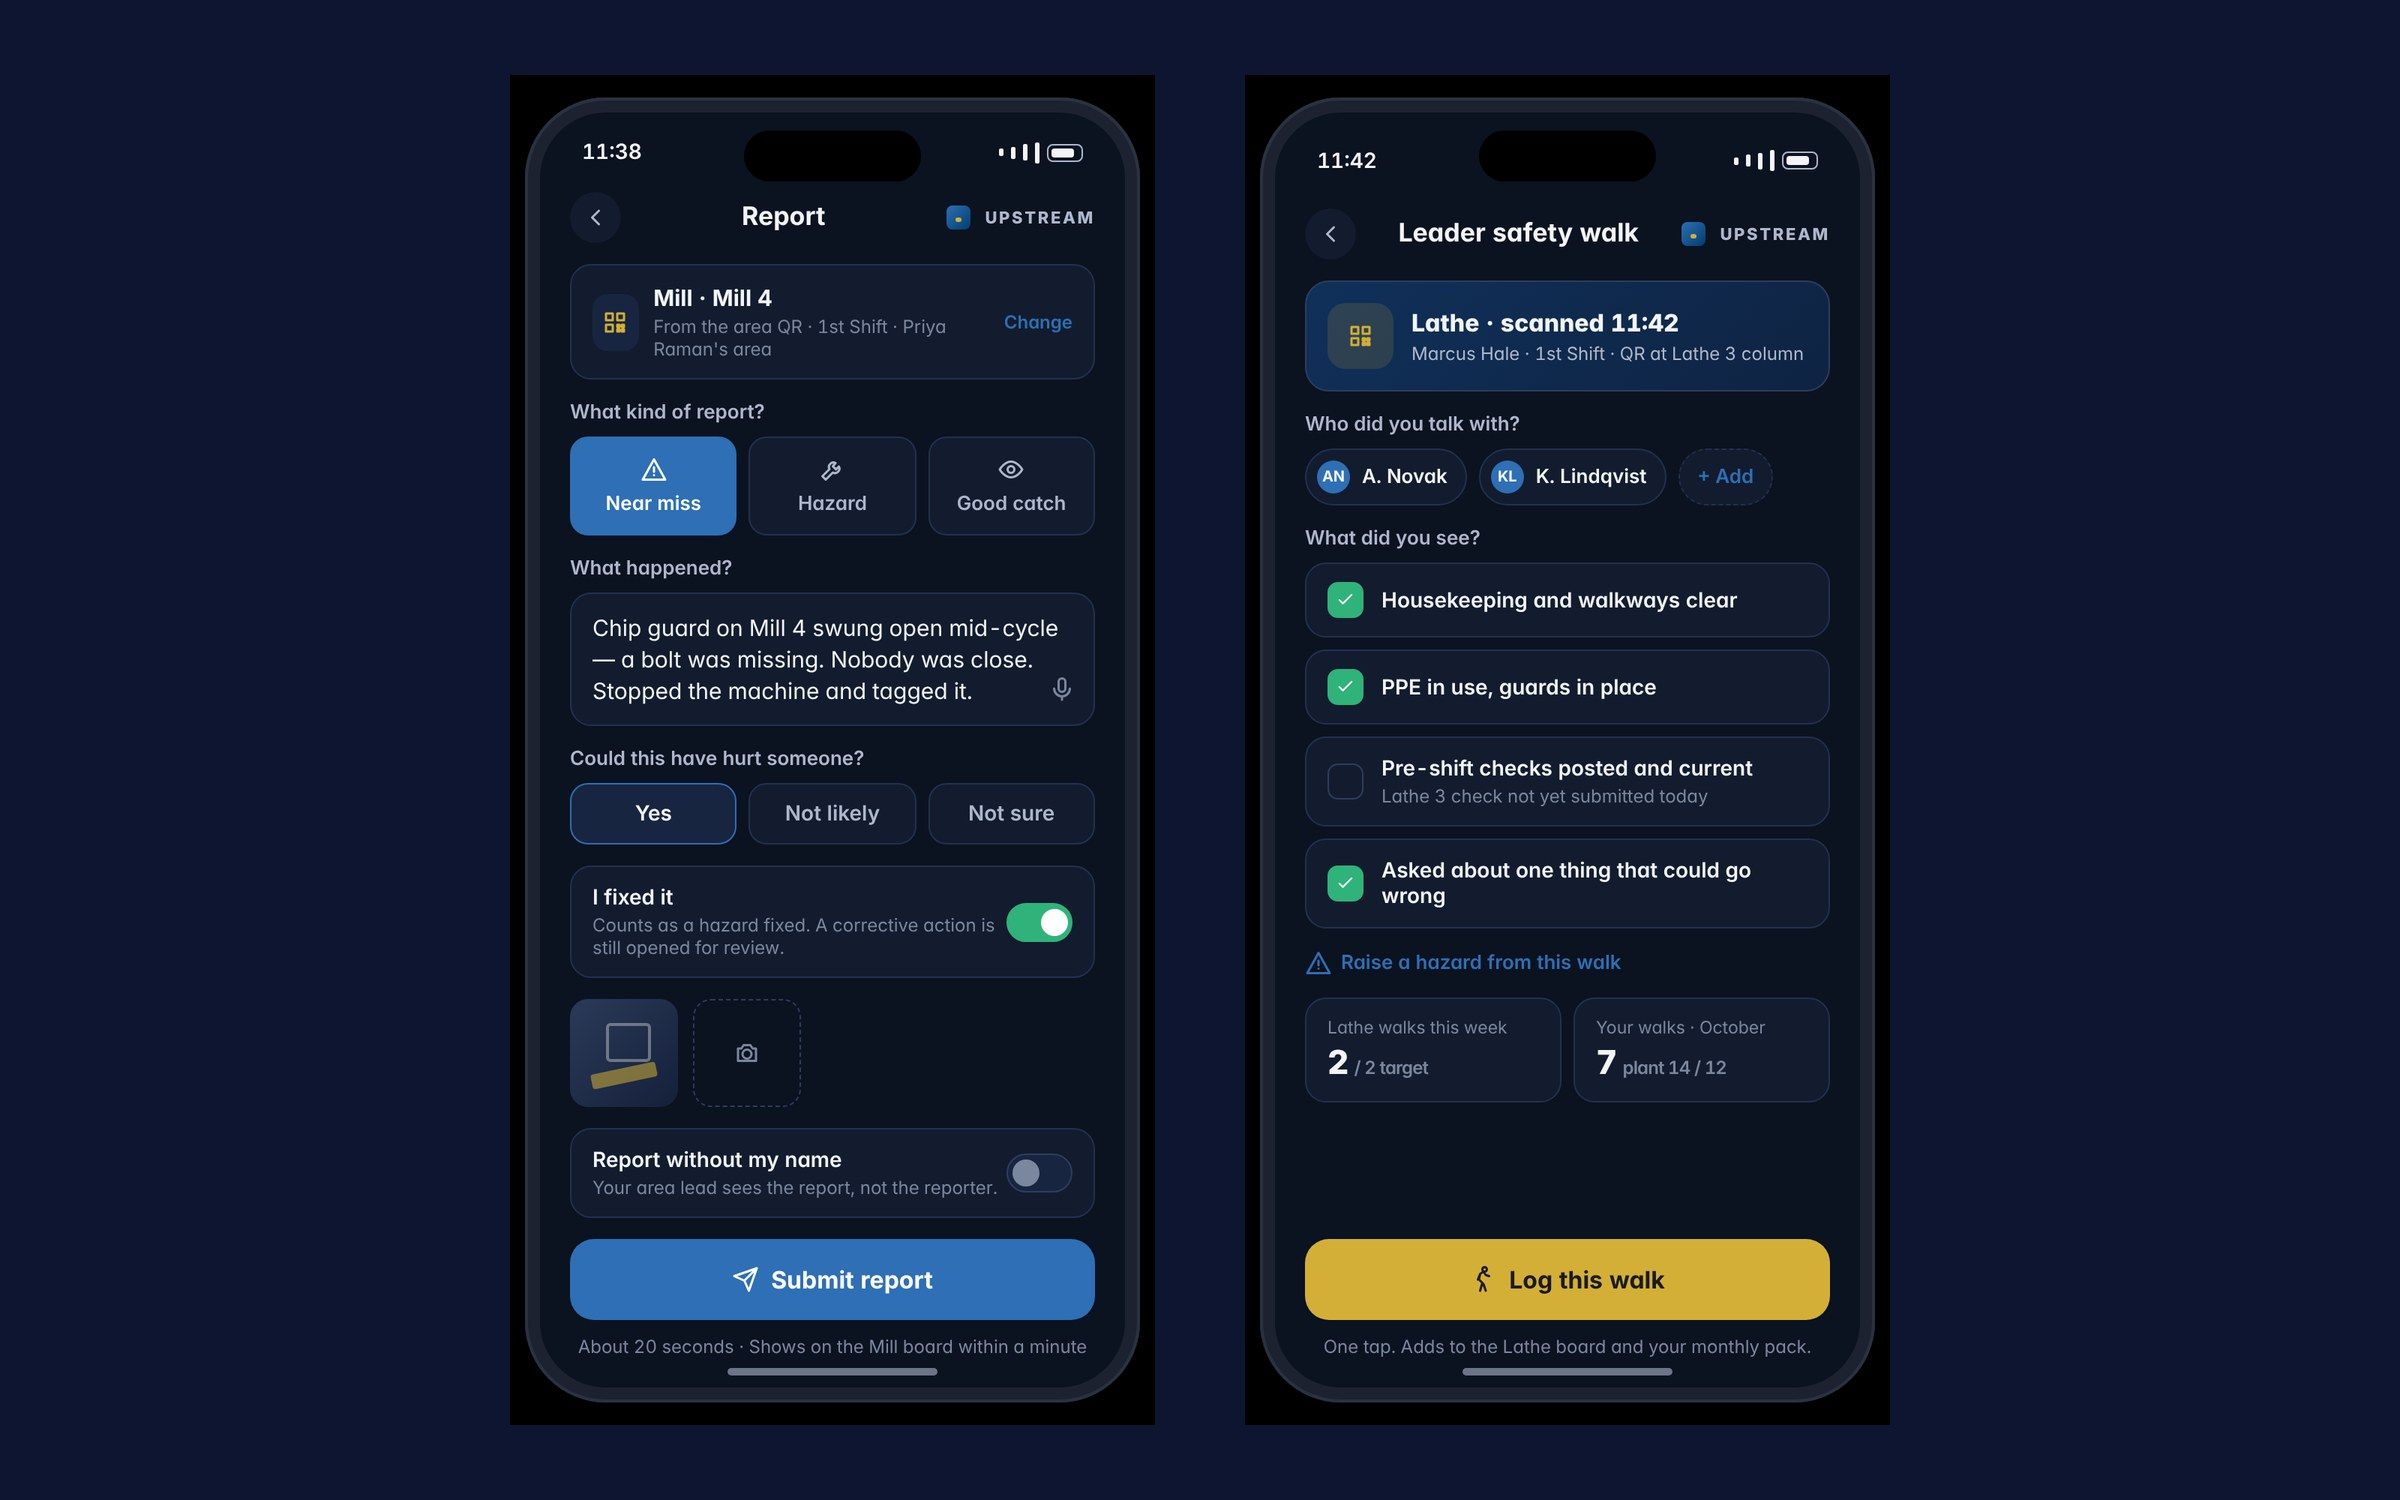
4.2 Report in twenty seconds, log a walk in one tap. Image -
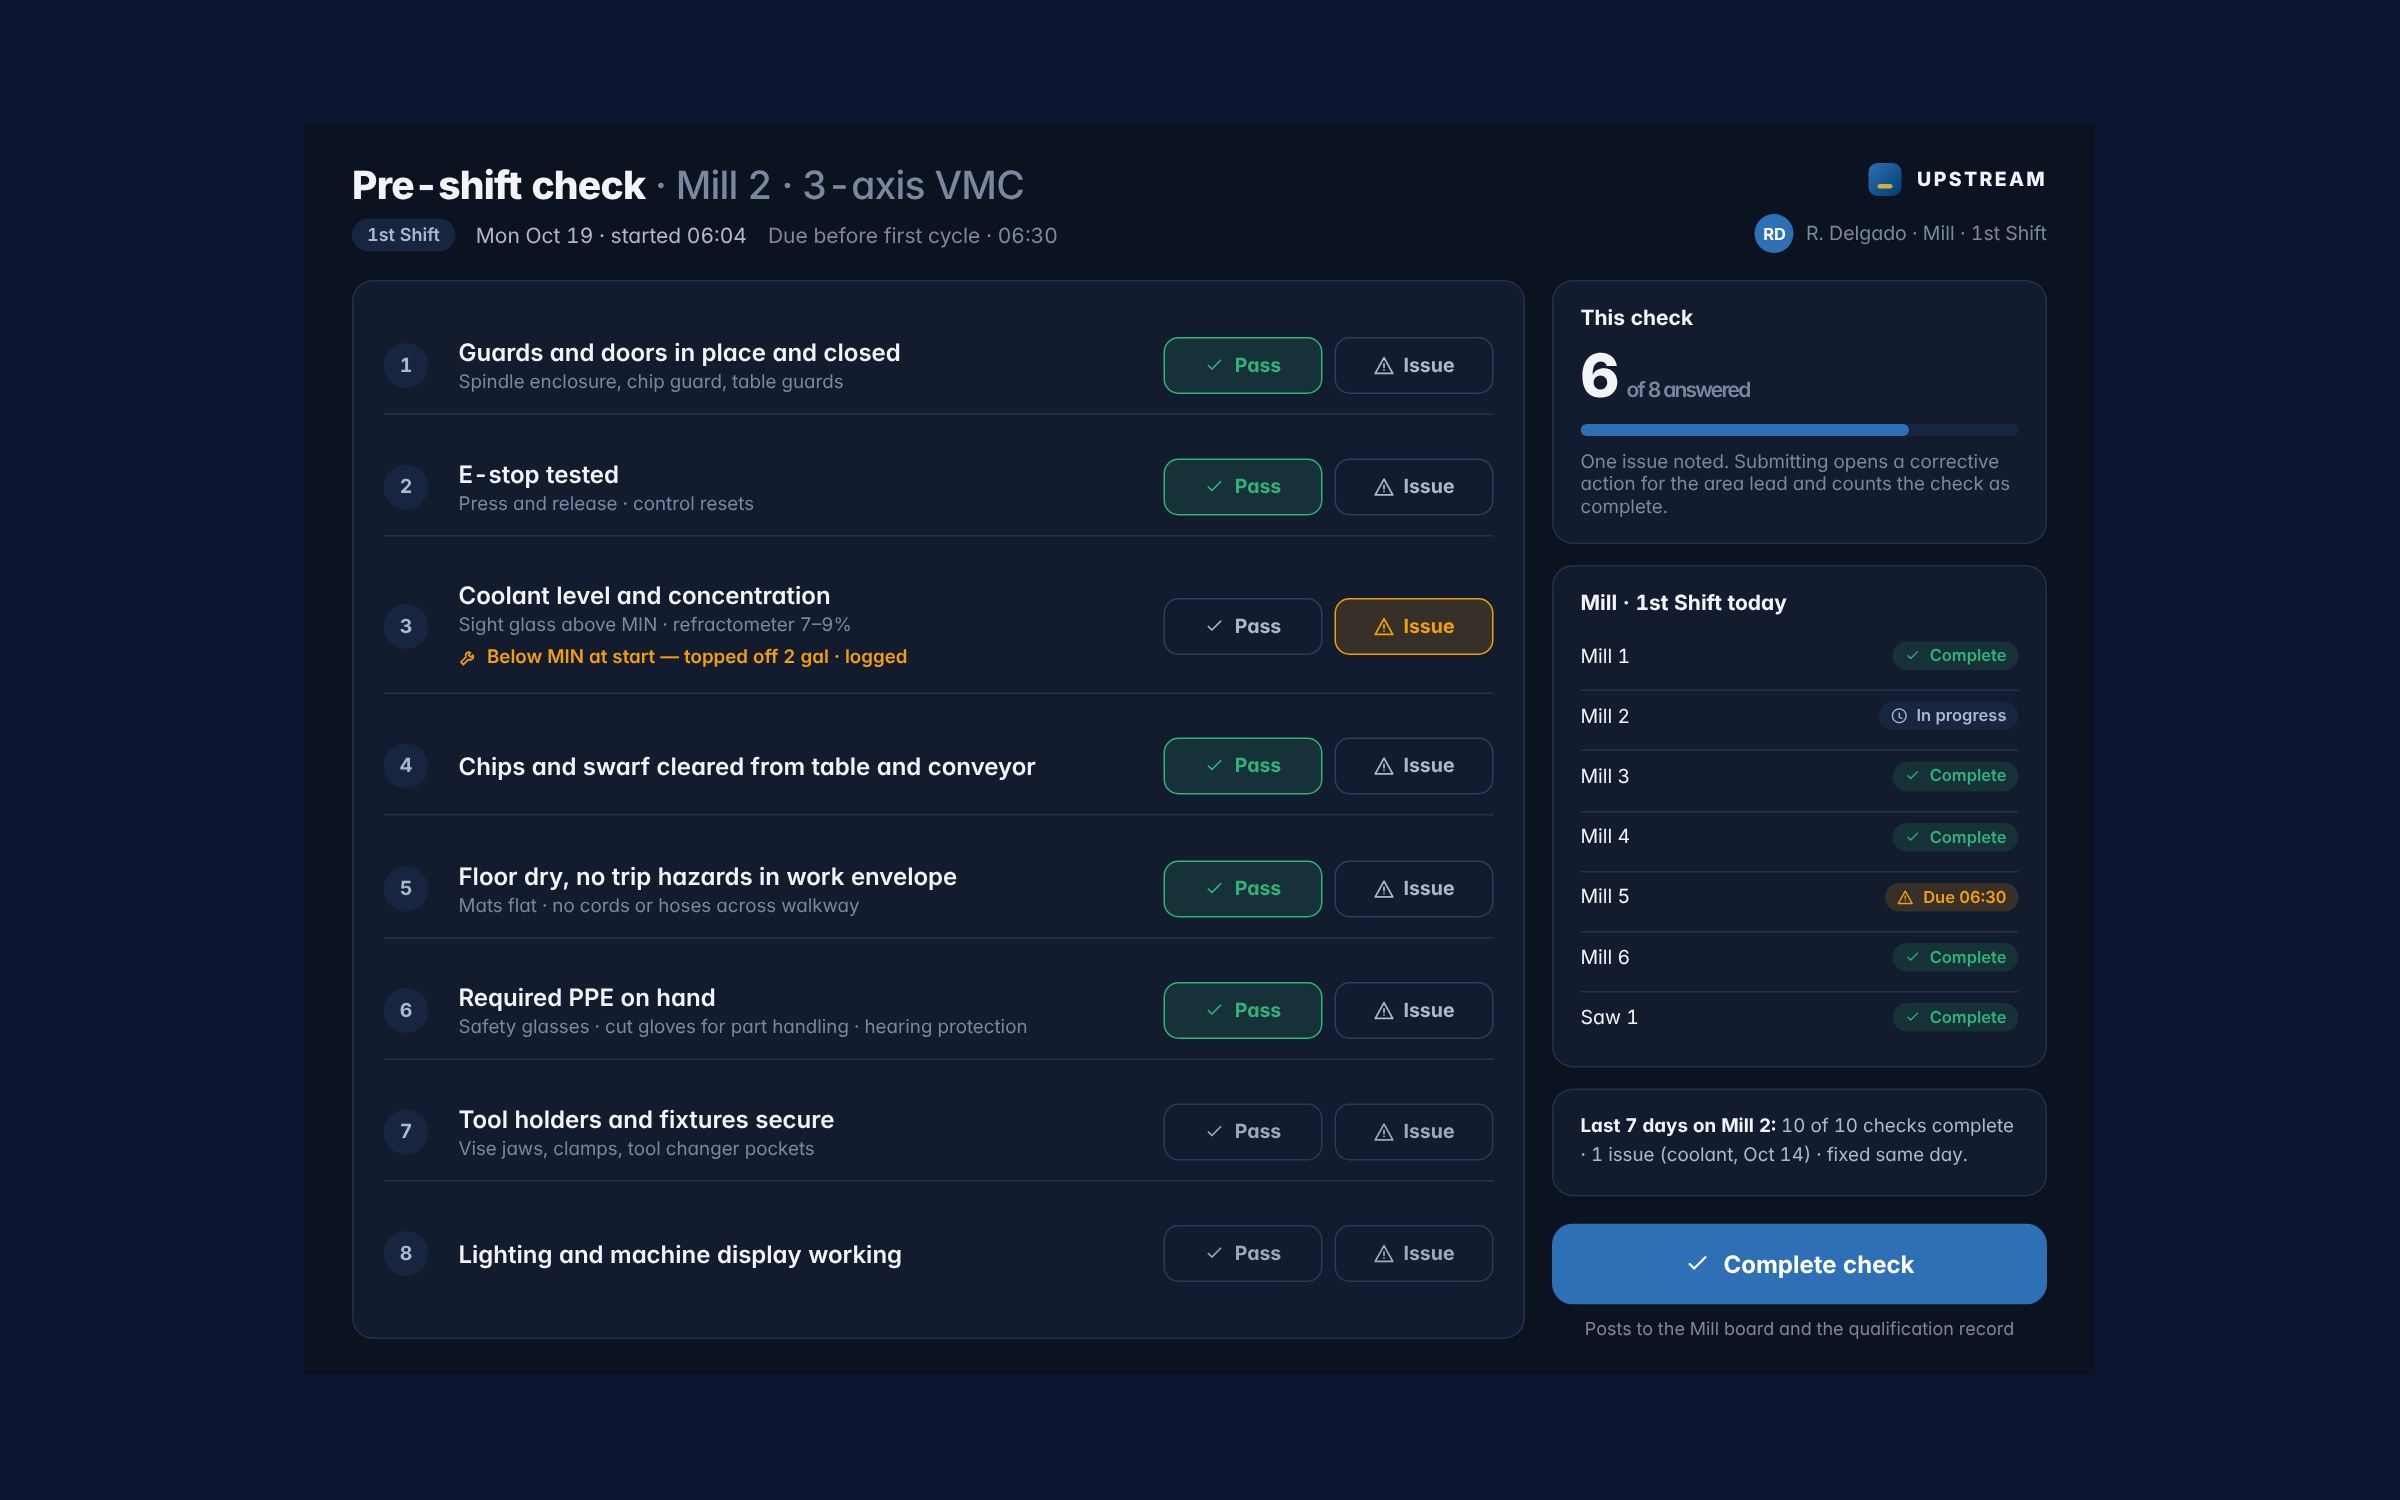
4.3 Checks feed the board as a completion rate, so routine compliance does not swamp the discretionary acts. Image -
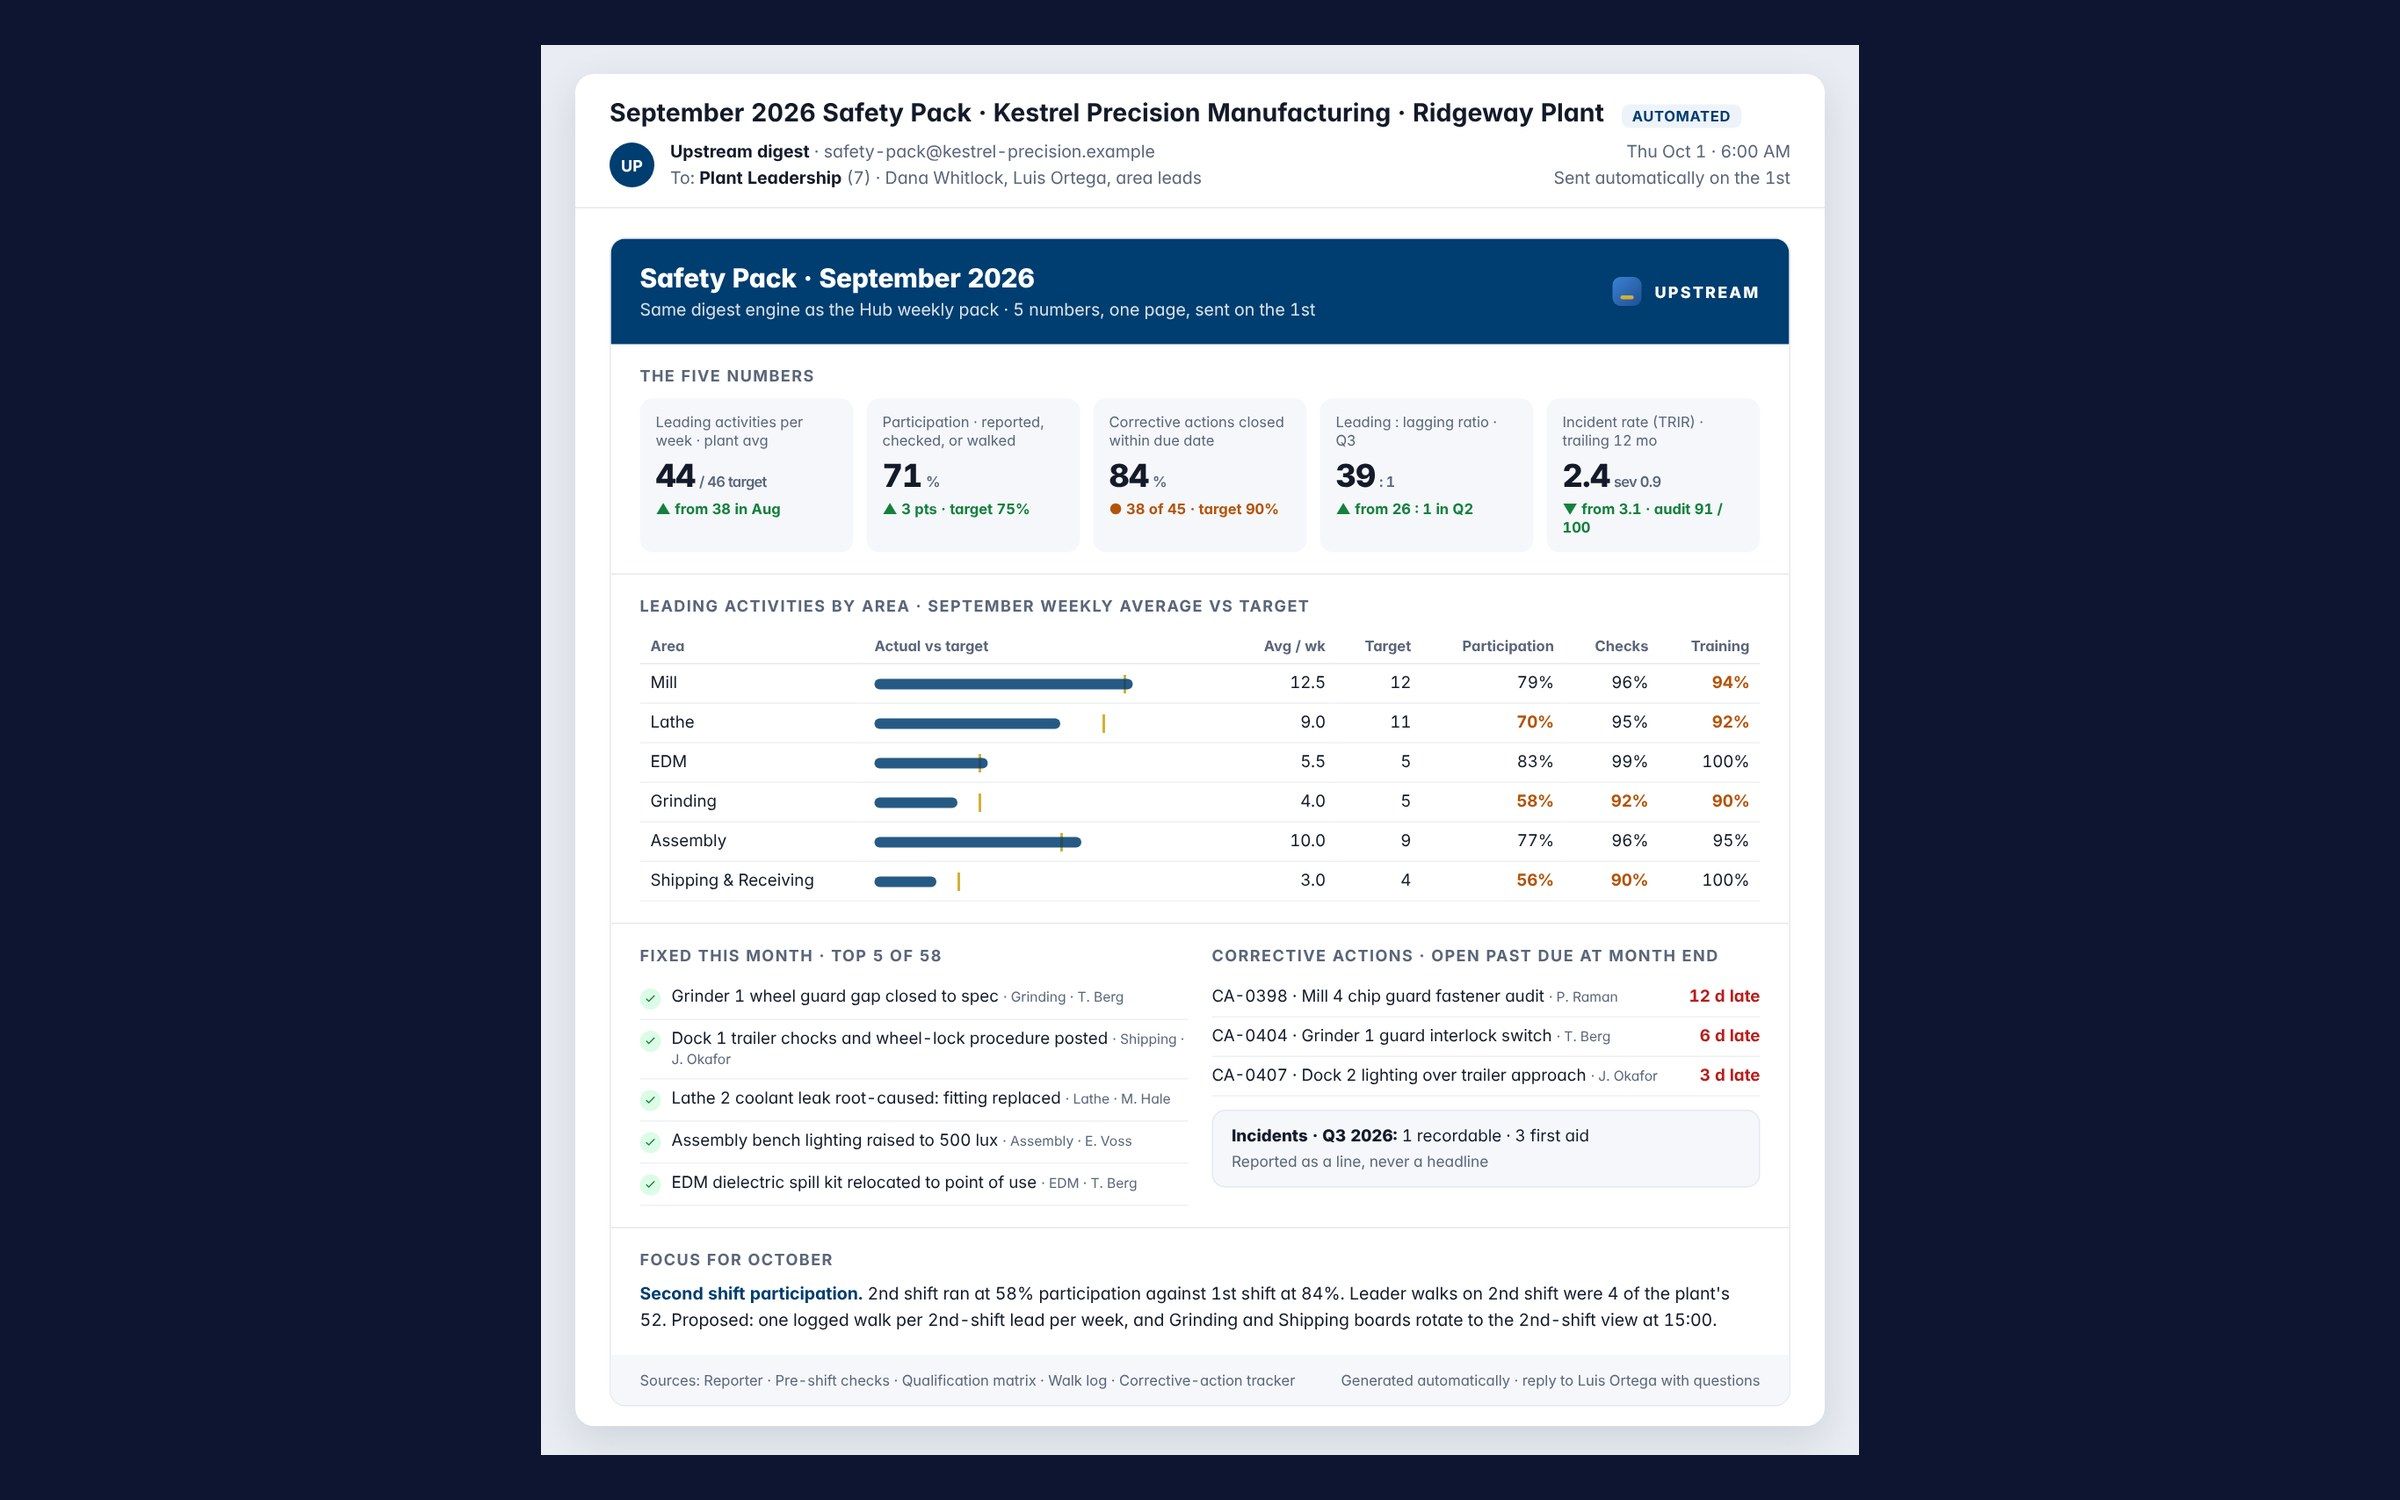
4.4 Five numbers on one page, sent on the first, written by the data. Image