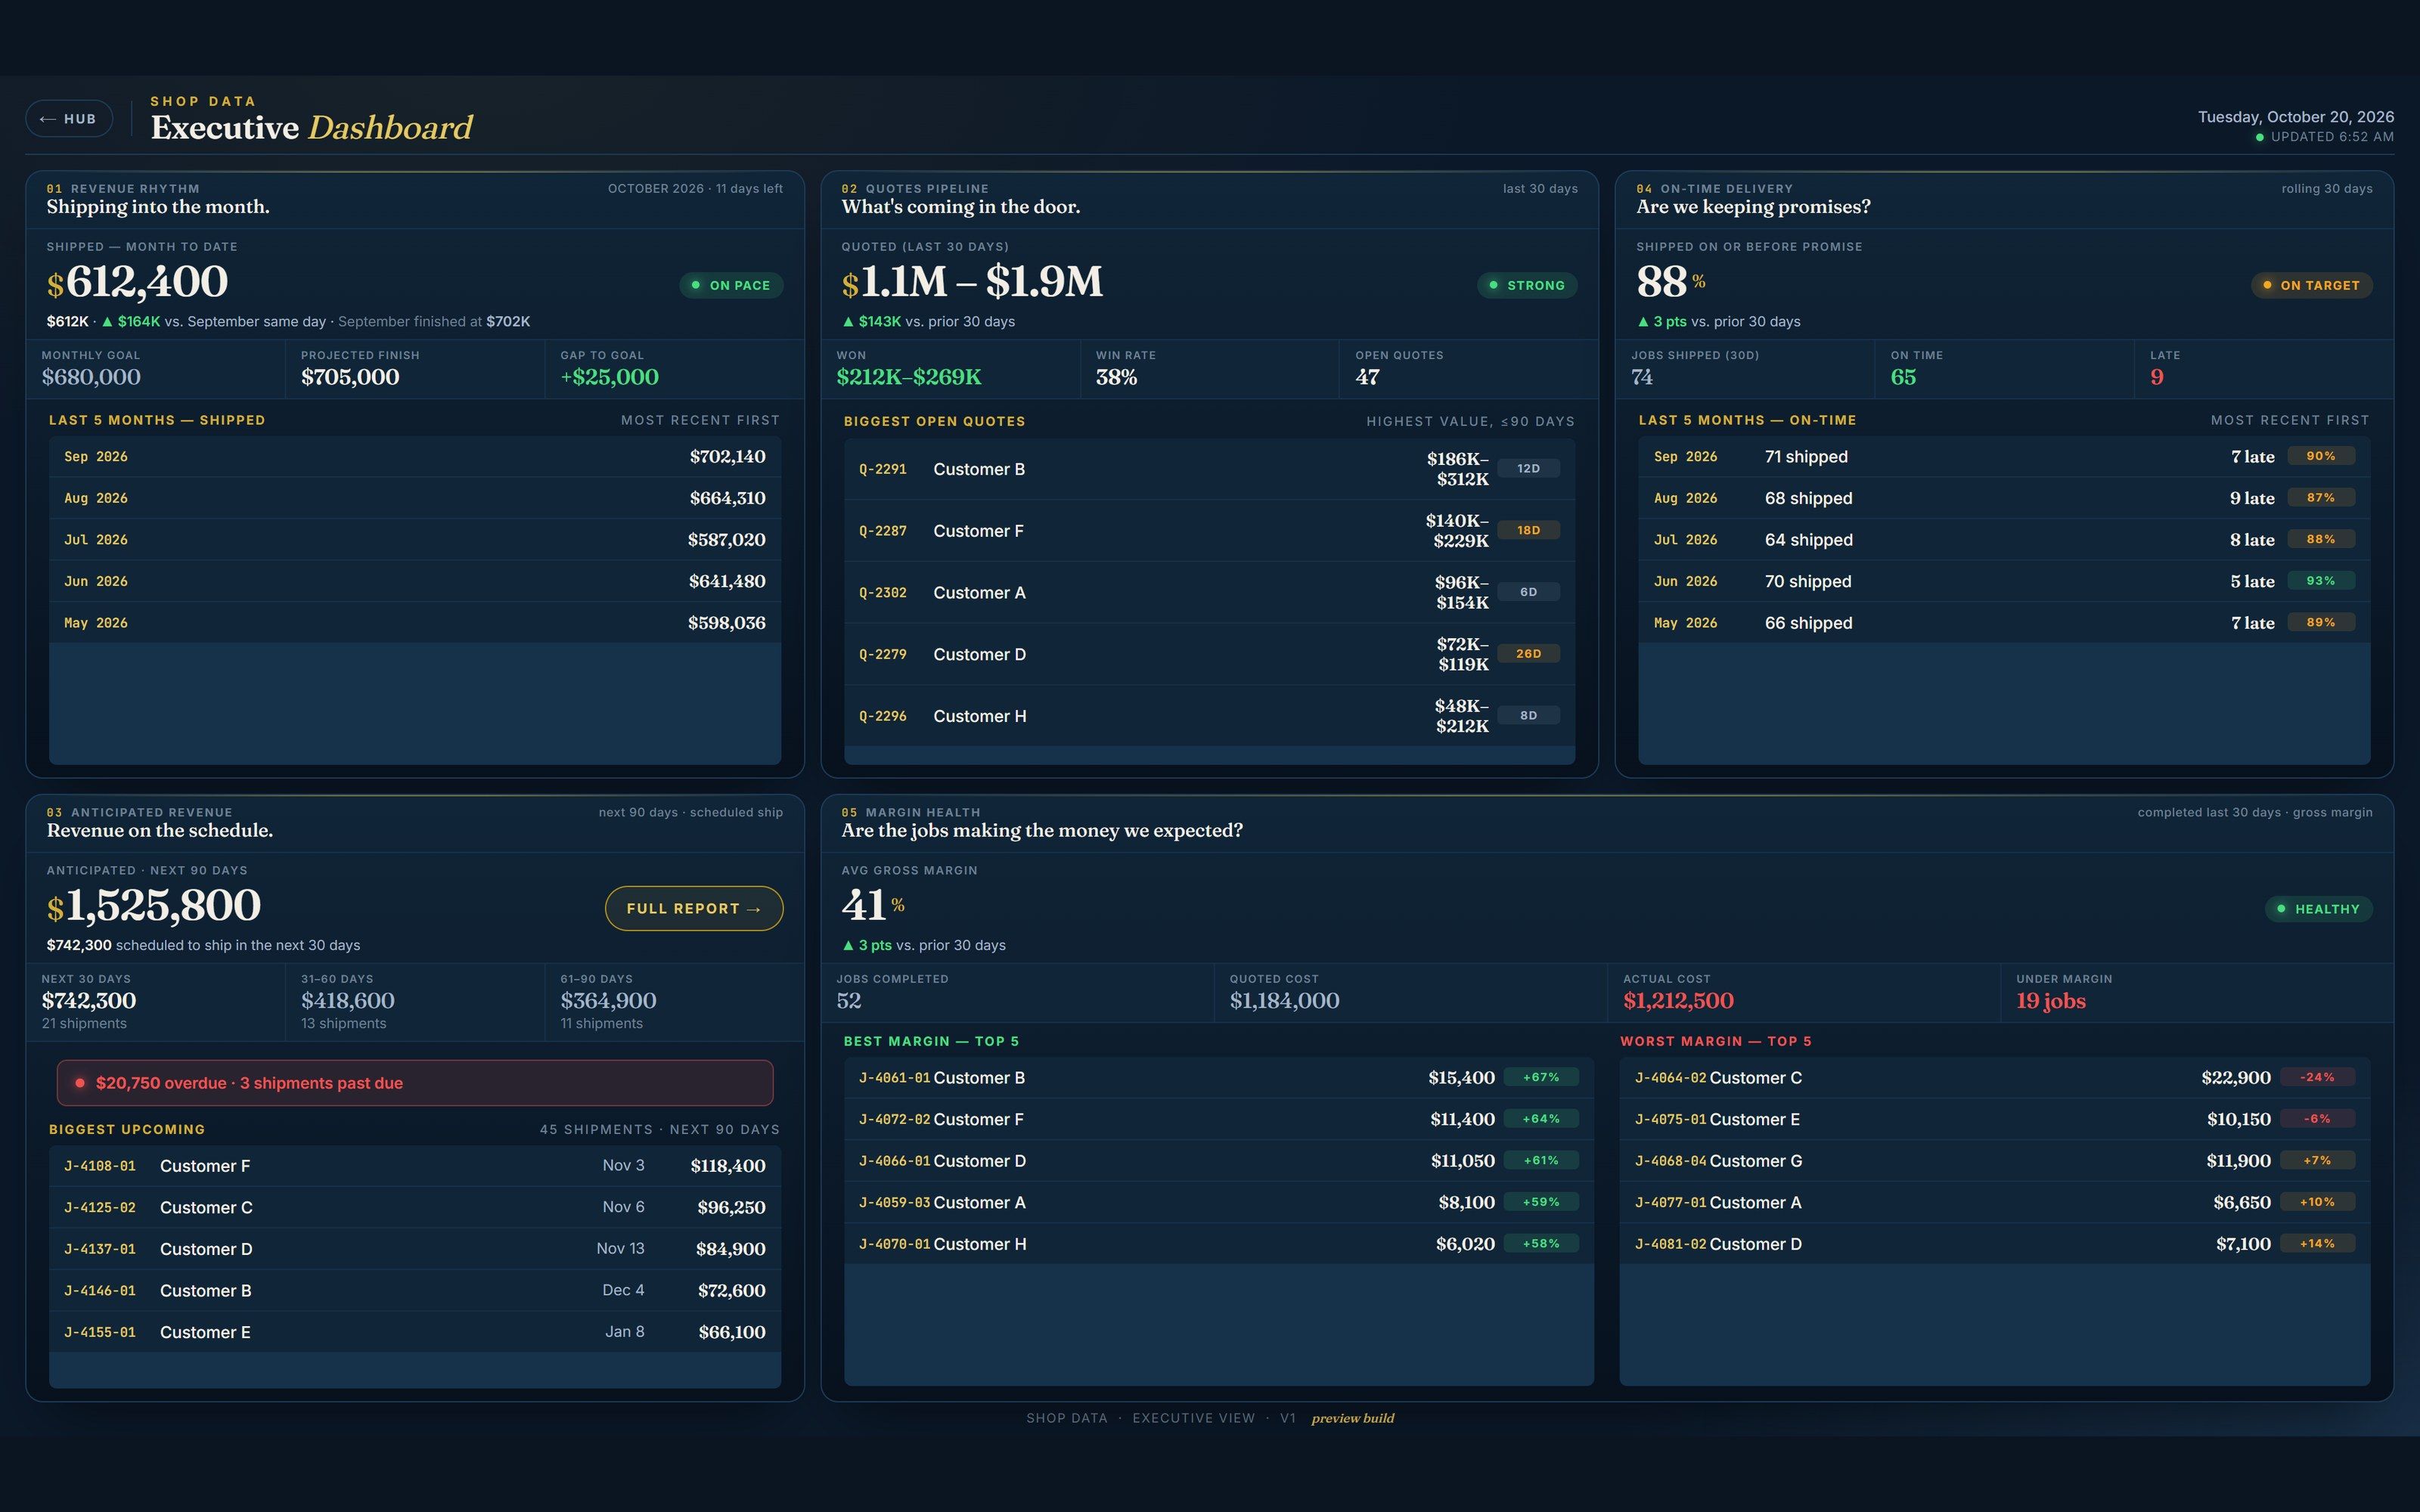
Shop Data Hub: one trusted set of numbers for the whole shop
- Role
- Creator
- Year
- 2026
- Tools
- Proprietary stack
Overview
A read-only hub that turns ERP records into validated, hourly reporting for a machine shop, from revenue, backlog, and margin down to the live floor.
Problem
The shop had plenty of data and almost none of it could be trusted or seen.
Weekly status and backlog spreadsheets re-keyed numbers the ERP already held, and every copy drifted a little further from the source. Revenue, backlog, and on-time delivery were calculated differently by each person who needed them, so meetings opened with reconciling instead of deciding. Some errors no report could catch at all: an operator running two machines logged a full day of labor on each, and labor cost and machine hours were quietly overstated.
The ERP was the right system of record. What was missing was a layer that reads it faithfully, checks it, and shows it plainly.
Approach
Build a read-only pipeline from the ERP to every screen, and validate it against the books before anyone sees a number.
A scheduled sync reads the ERP every hour, and every ten minutes for the shop floor, through queries that cannot write; a guard refuses any that would. Only computed summaries leave the sync PC, so the full ERP, pay rates, and personal records never leave the building. Dashboards read the summary store, never the ERP itself, and each person signs in with their own login and sees the modules their role needs.
Accuracy came first. Each source table was probed before anything was built on it, and two expected sources turned out to be empty. Revenue for months finance had already closed was rebuilt and compared line by line. Every metric got a written definition that says exactly what is counted and excluded, in plain language: shipped revenue is shipped quantity times unit price on shipment records with freight, returns, and credits out; on-time counts a late partial as late; machine utilization divides spindle hours by the hours the machine was actually available, not a 24-hour day. A test value was pushed through the pipeline, confirmed on screen, and removed.
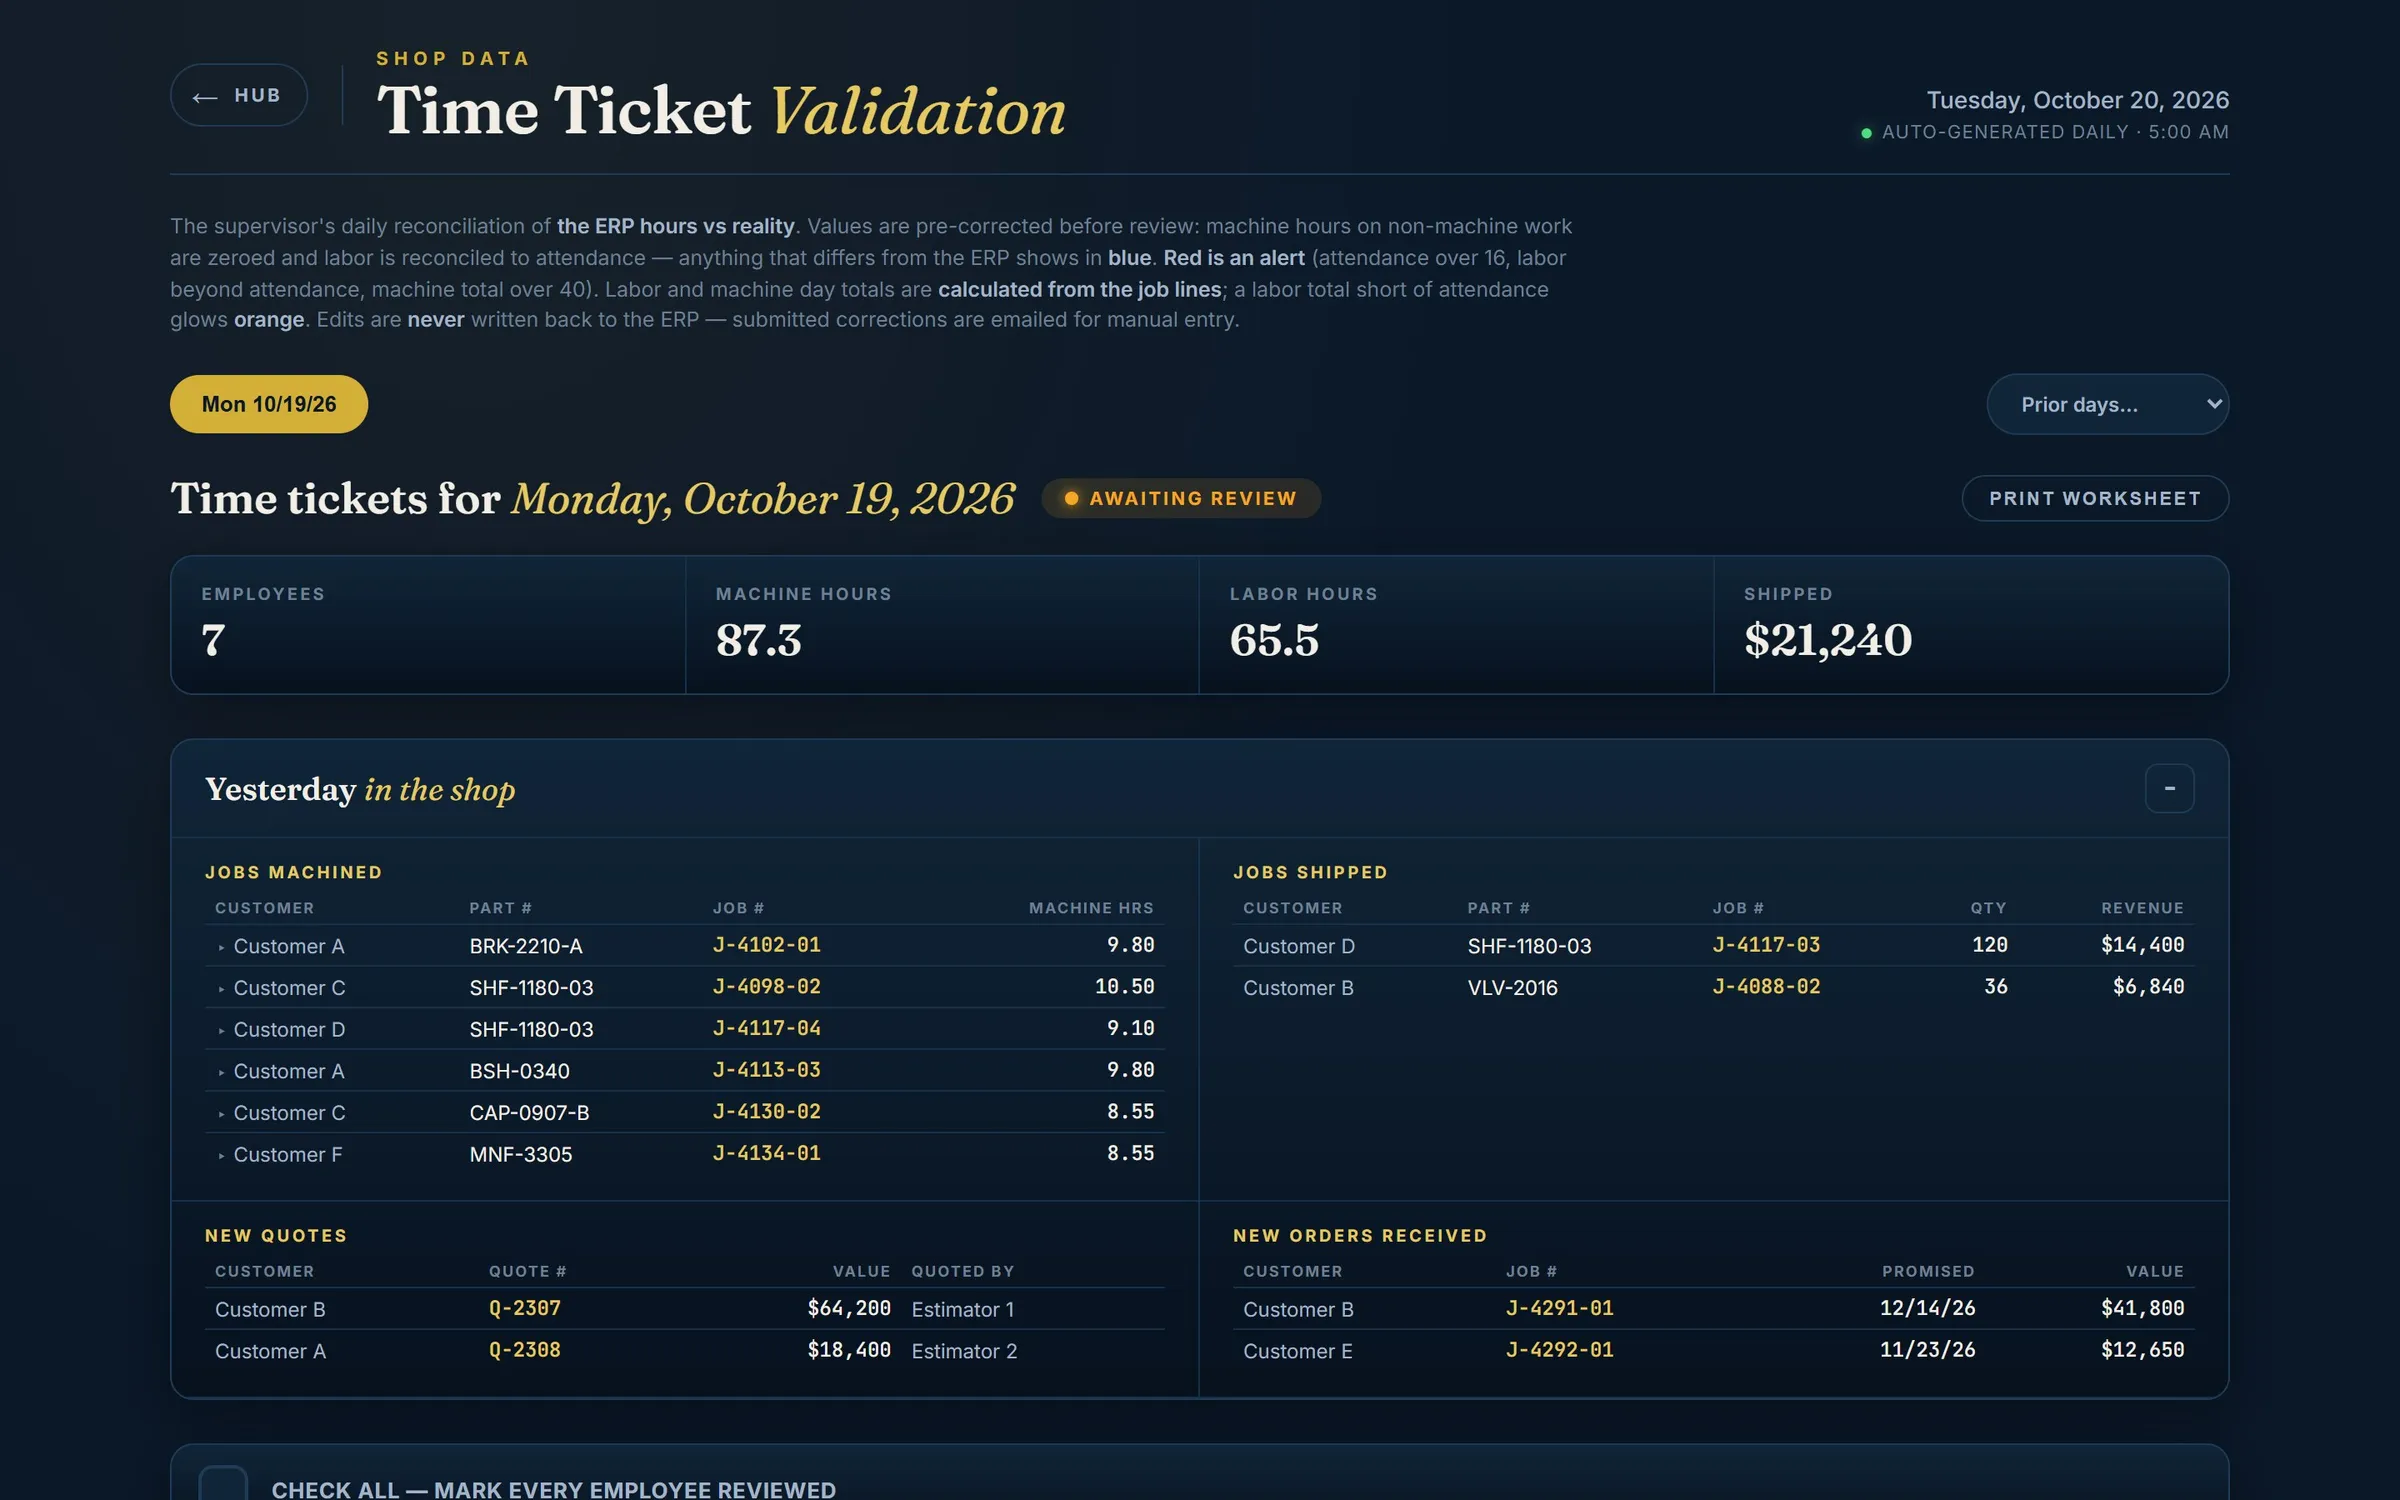
Where the data is wrong or missing, the hub says so instead of guessing. Jobs with no cost clocked stay off the best-margin list rather than ranking first at a fake 100 percent. Stale deliveries are filtered, not counted as late. A quote with several quantity breaks shows its full range. A report waiting on its first sync says so instead of showing zeros. And the double-counted labor got a fix at the source: every morning yesterday’s time tickets become a review form, labor is scaled to attendance with every change highlighted, the supervisor checks each person, and corrections go out by email. The ERP is never edited automatically.
Outcome
| Metric | Result |
|---|---|
| ERP access | Read-only; nothing written back |
| Refresh | Hourly; every 10 minutes on the floor |
| Definitions | One written definition per metric |
| Validation | Closed months rebuilt against finance |
Every number on the screen comes from one documented query, opens to the records behind it, and refreshes without anyone rebuilding a spreadsheet.
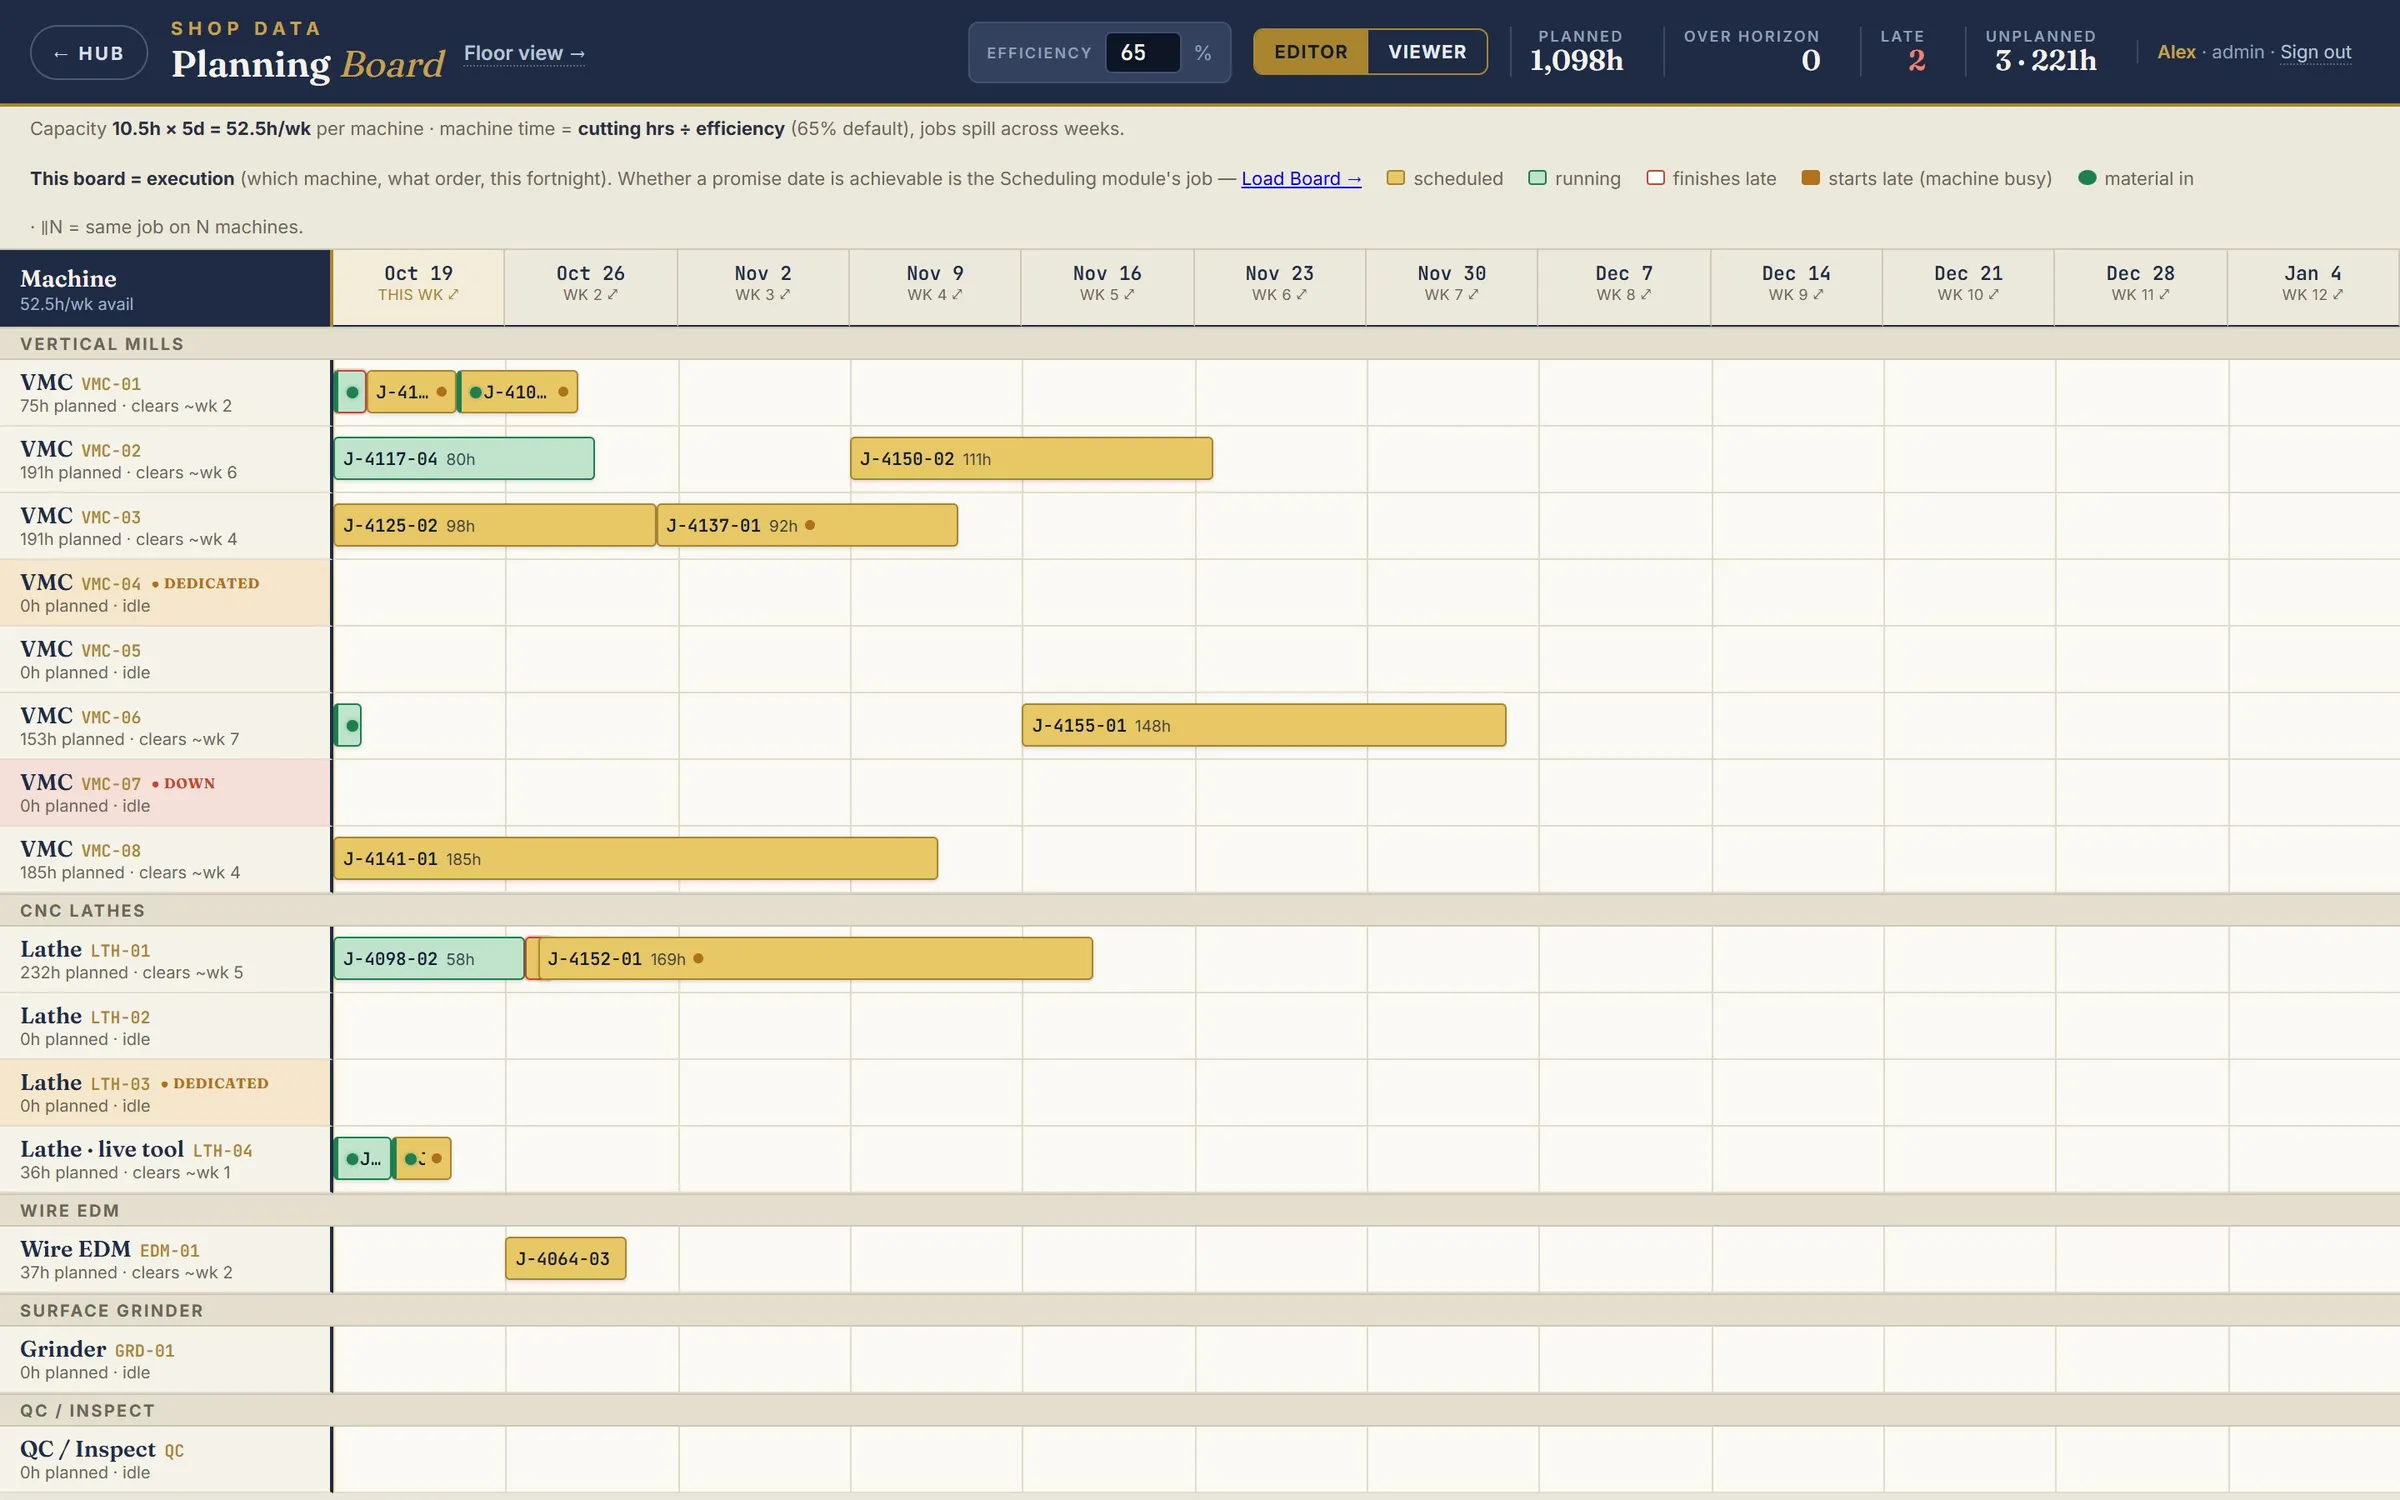
Report prep that used to be rebuilt by hand each week refreshes every hour. A disputed number has one written definition and one query. Double-counted labor is flagged and corrected the next morning instead of surfacing when a margin looks wrong. A late shipment turns red the day its promised date passes rather than at month end. “Are we at capacity” is measured by pool against real shifts, and job status is live from the ERP with notes and a dated log. The same views arrive as a daily digest email before the shop opens, with anything that strayed from its trailing average flagged automatically.
Gallery
-
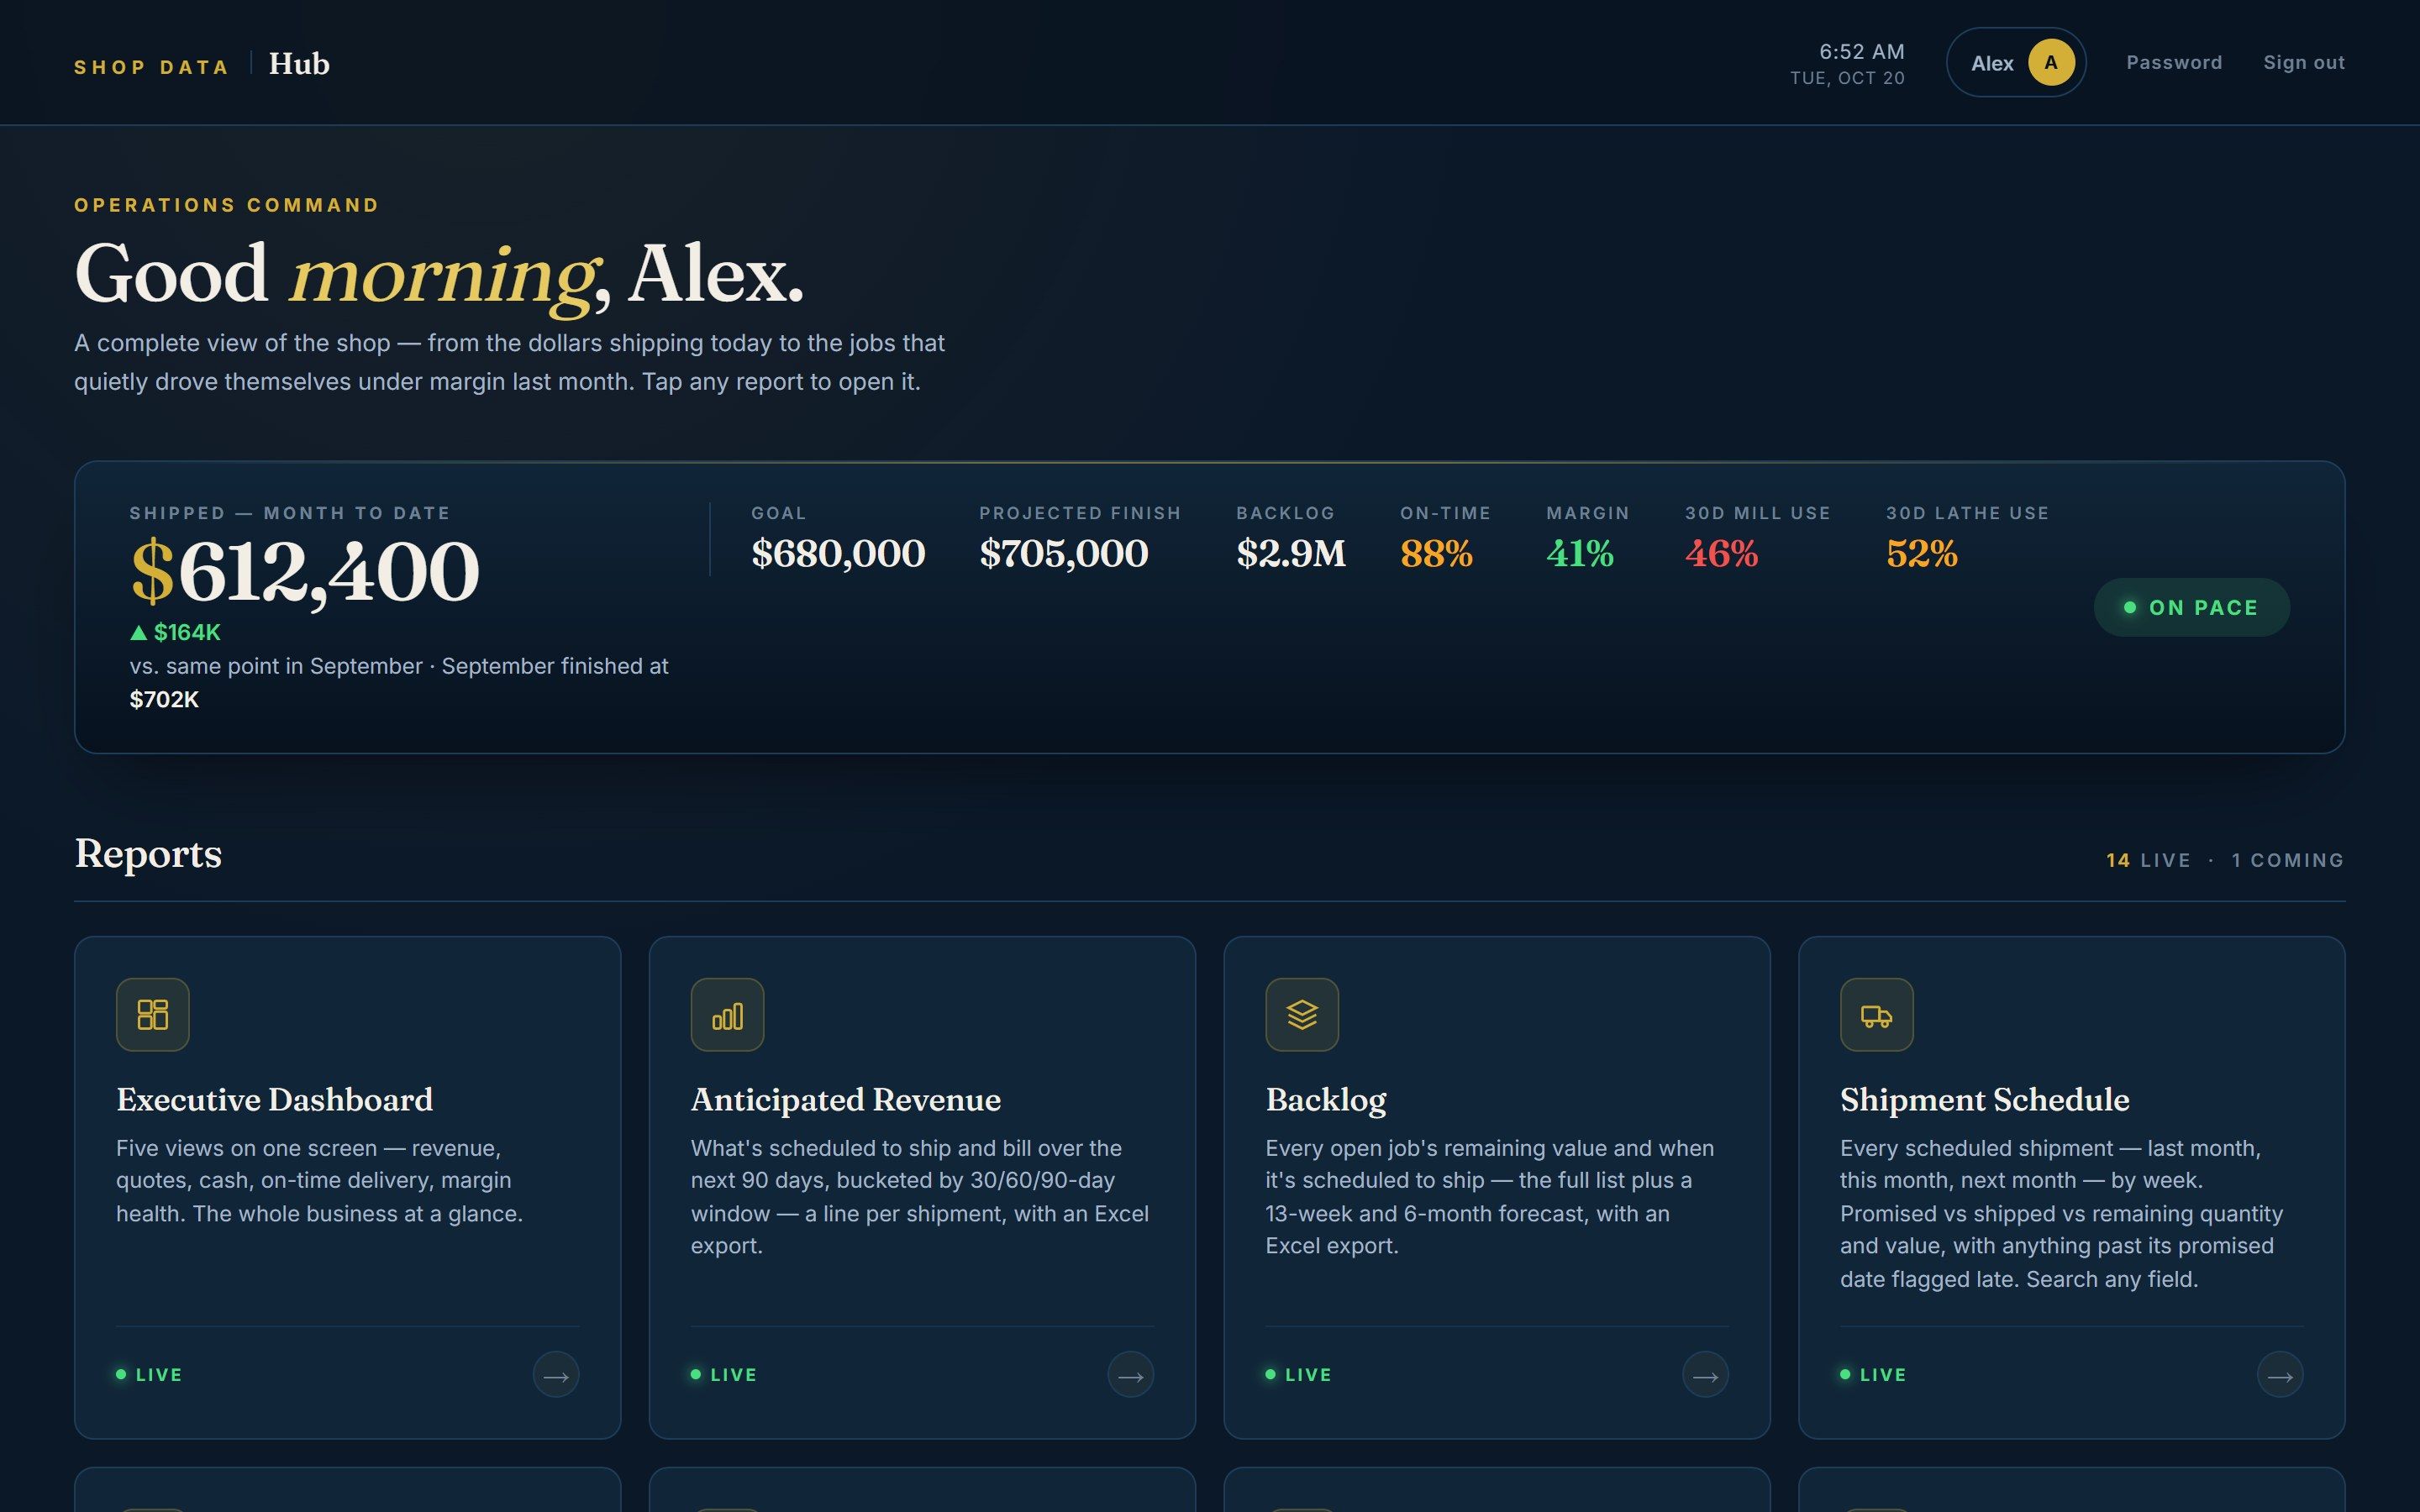
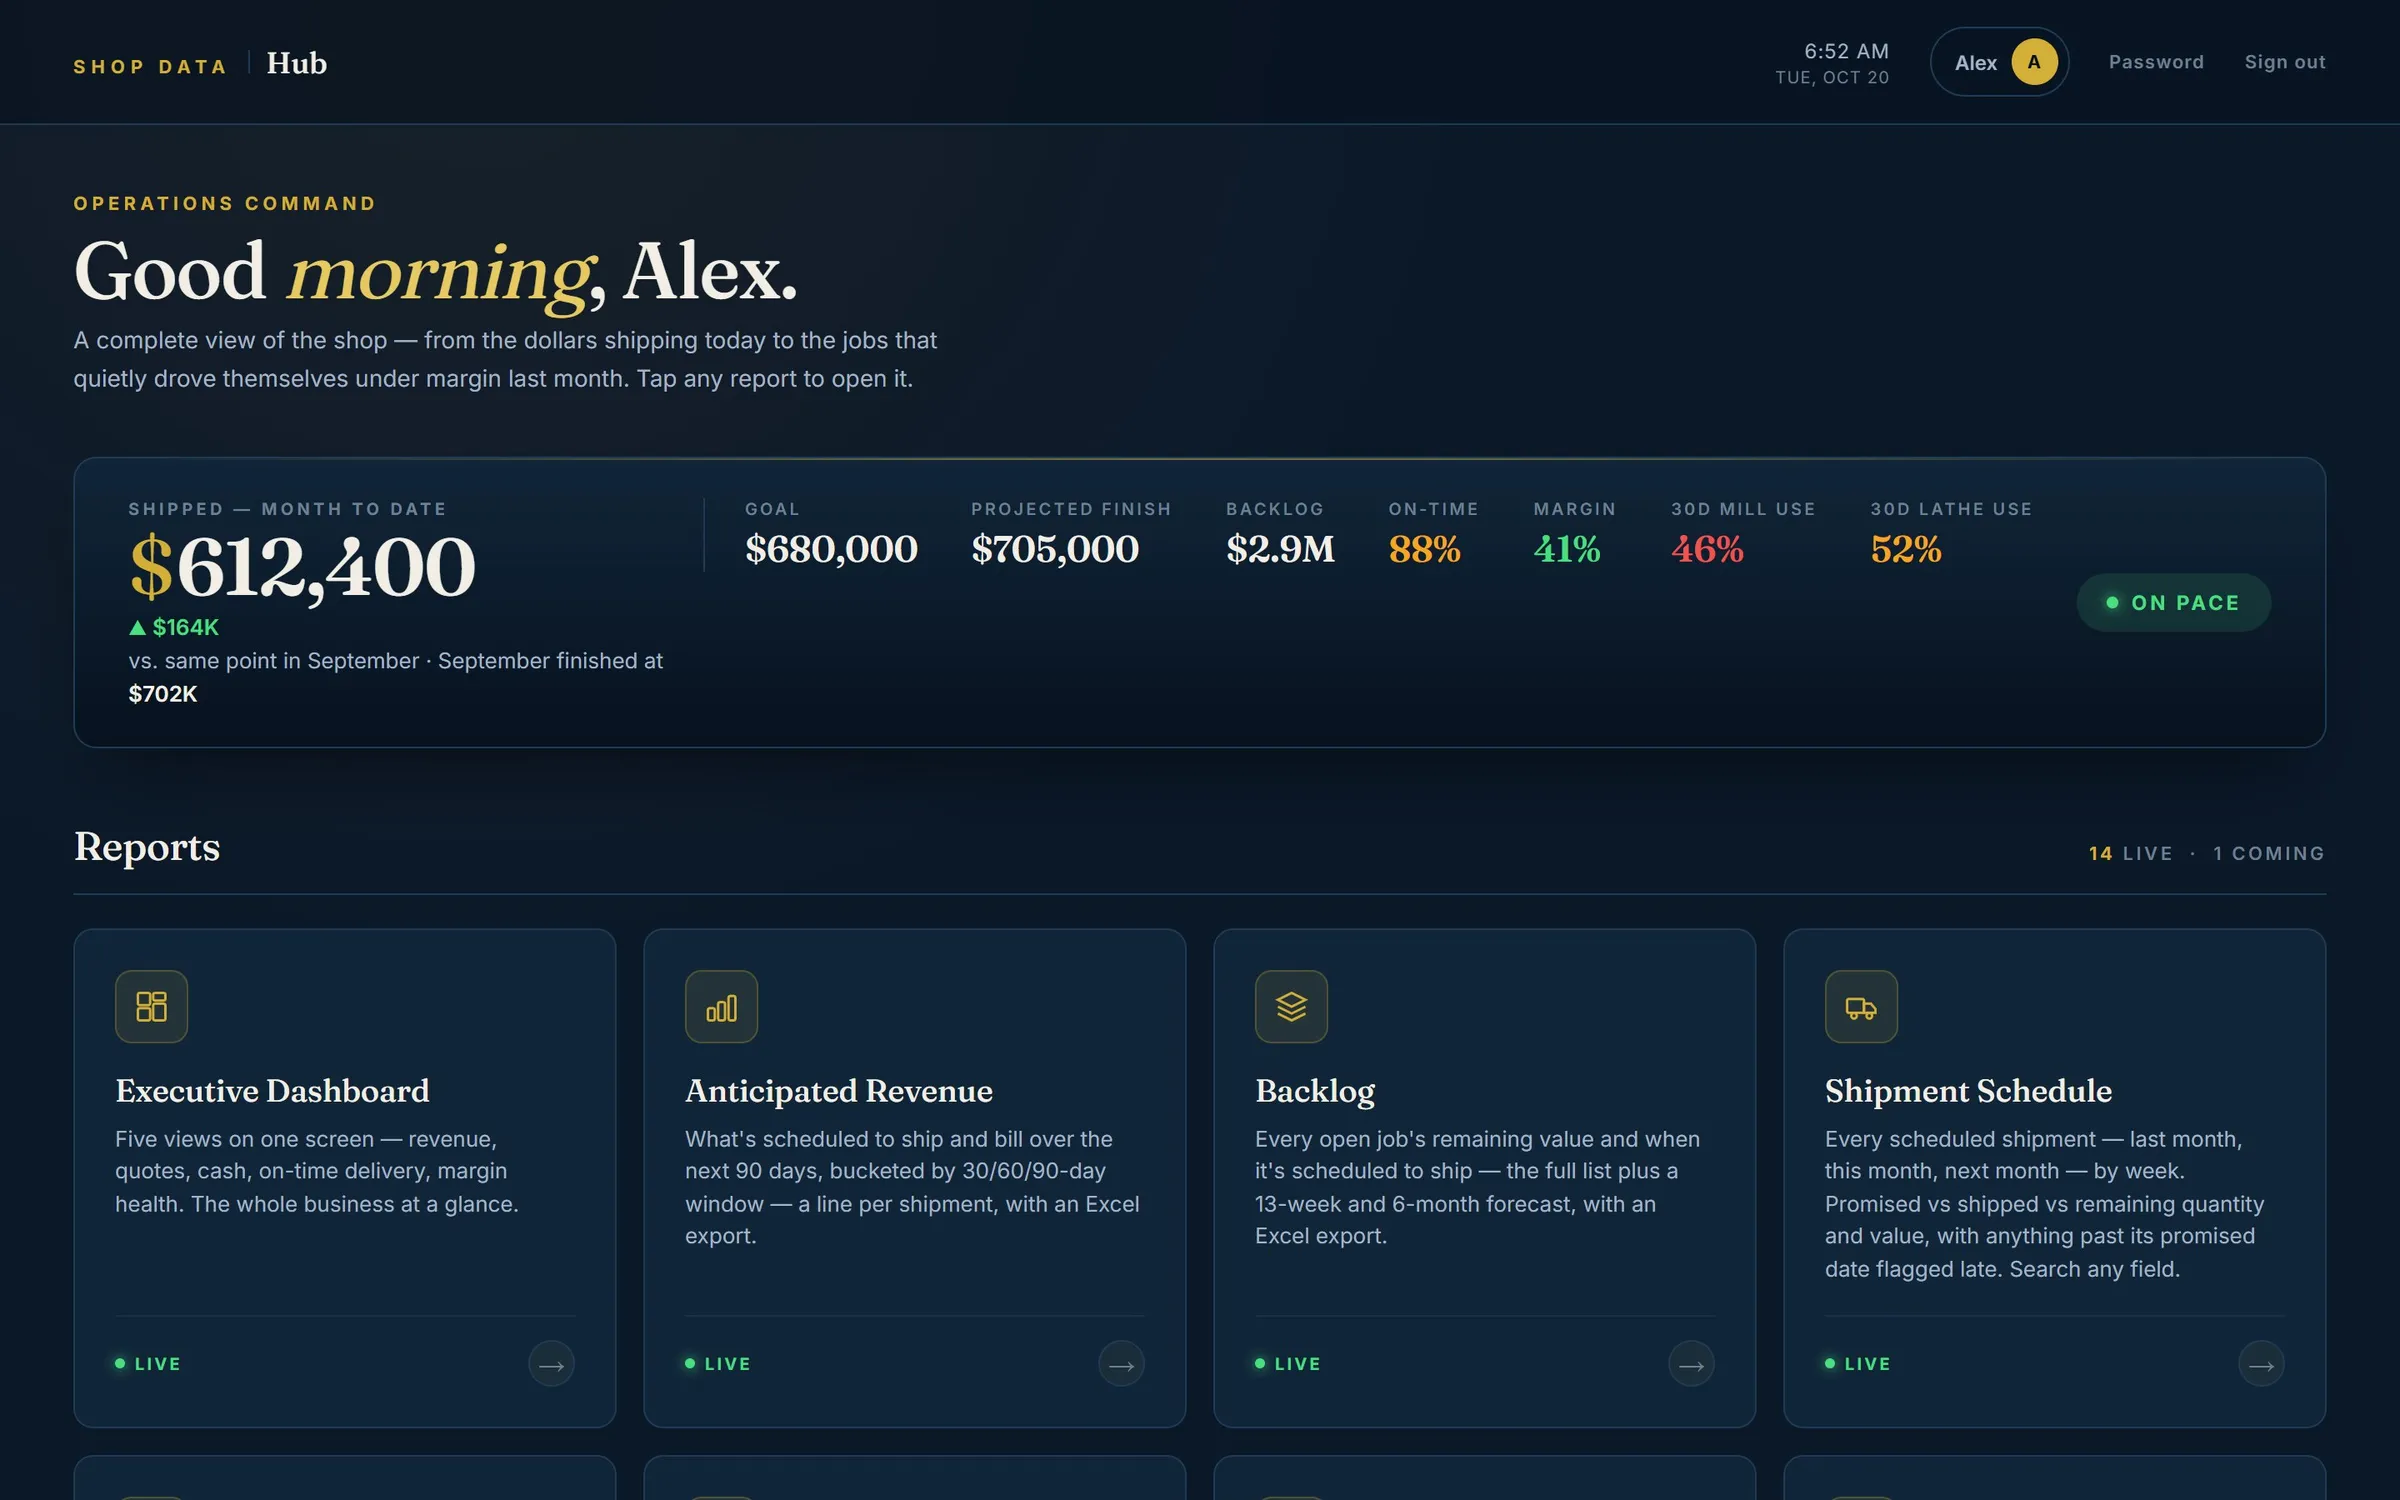
4.0 The home screen does work before anyone clicks. The month's numbers sit in one strip and every report is a tap away. Image -
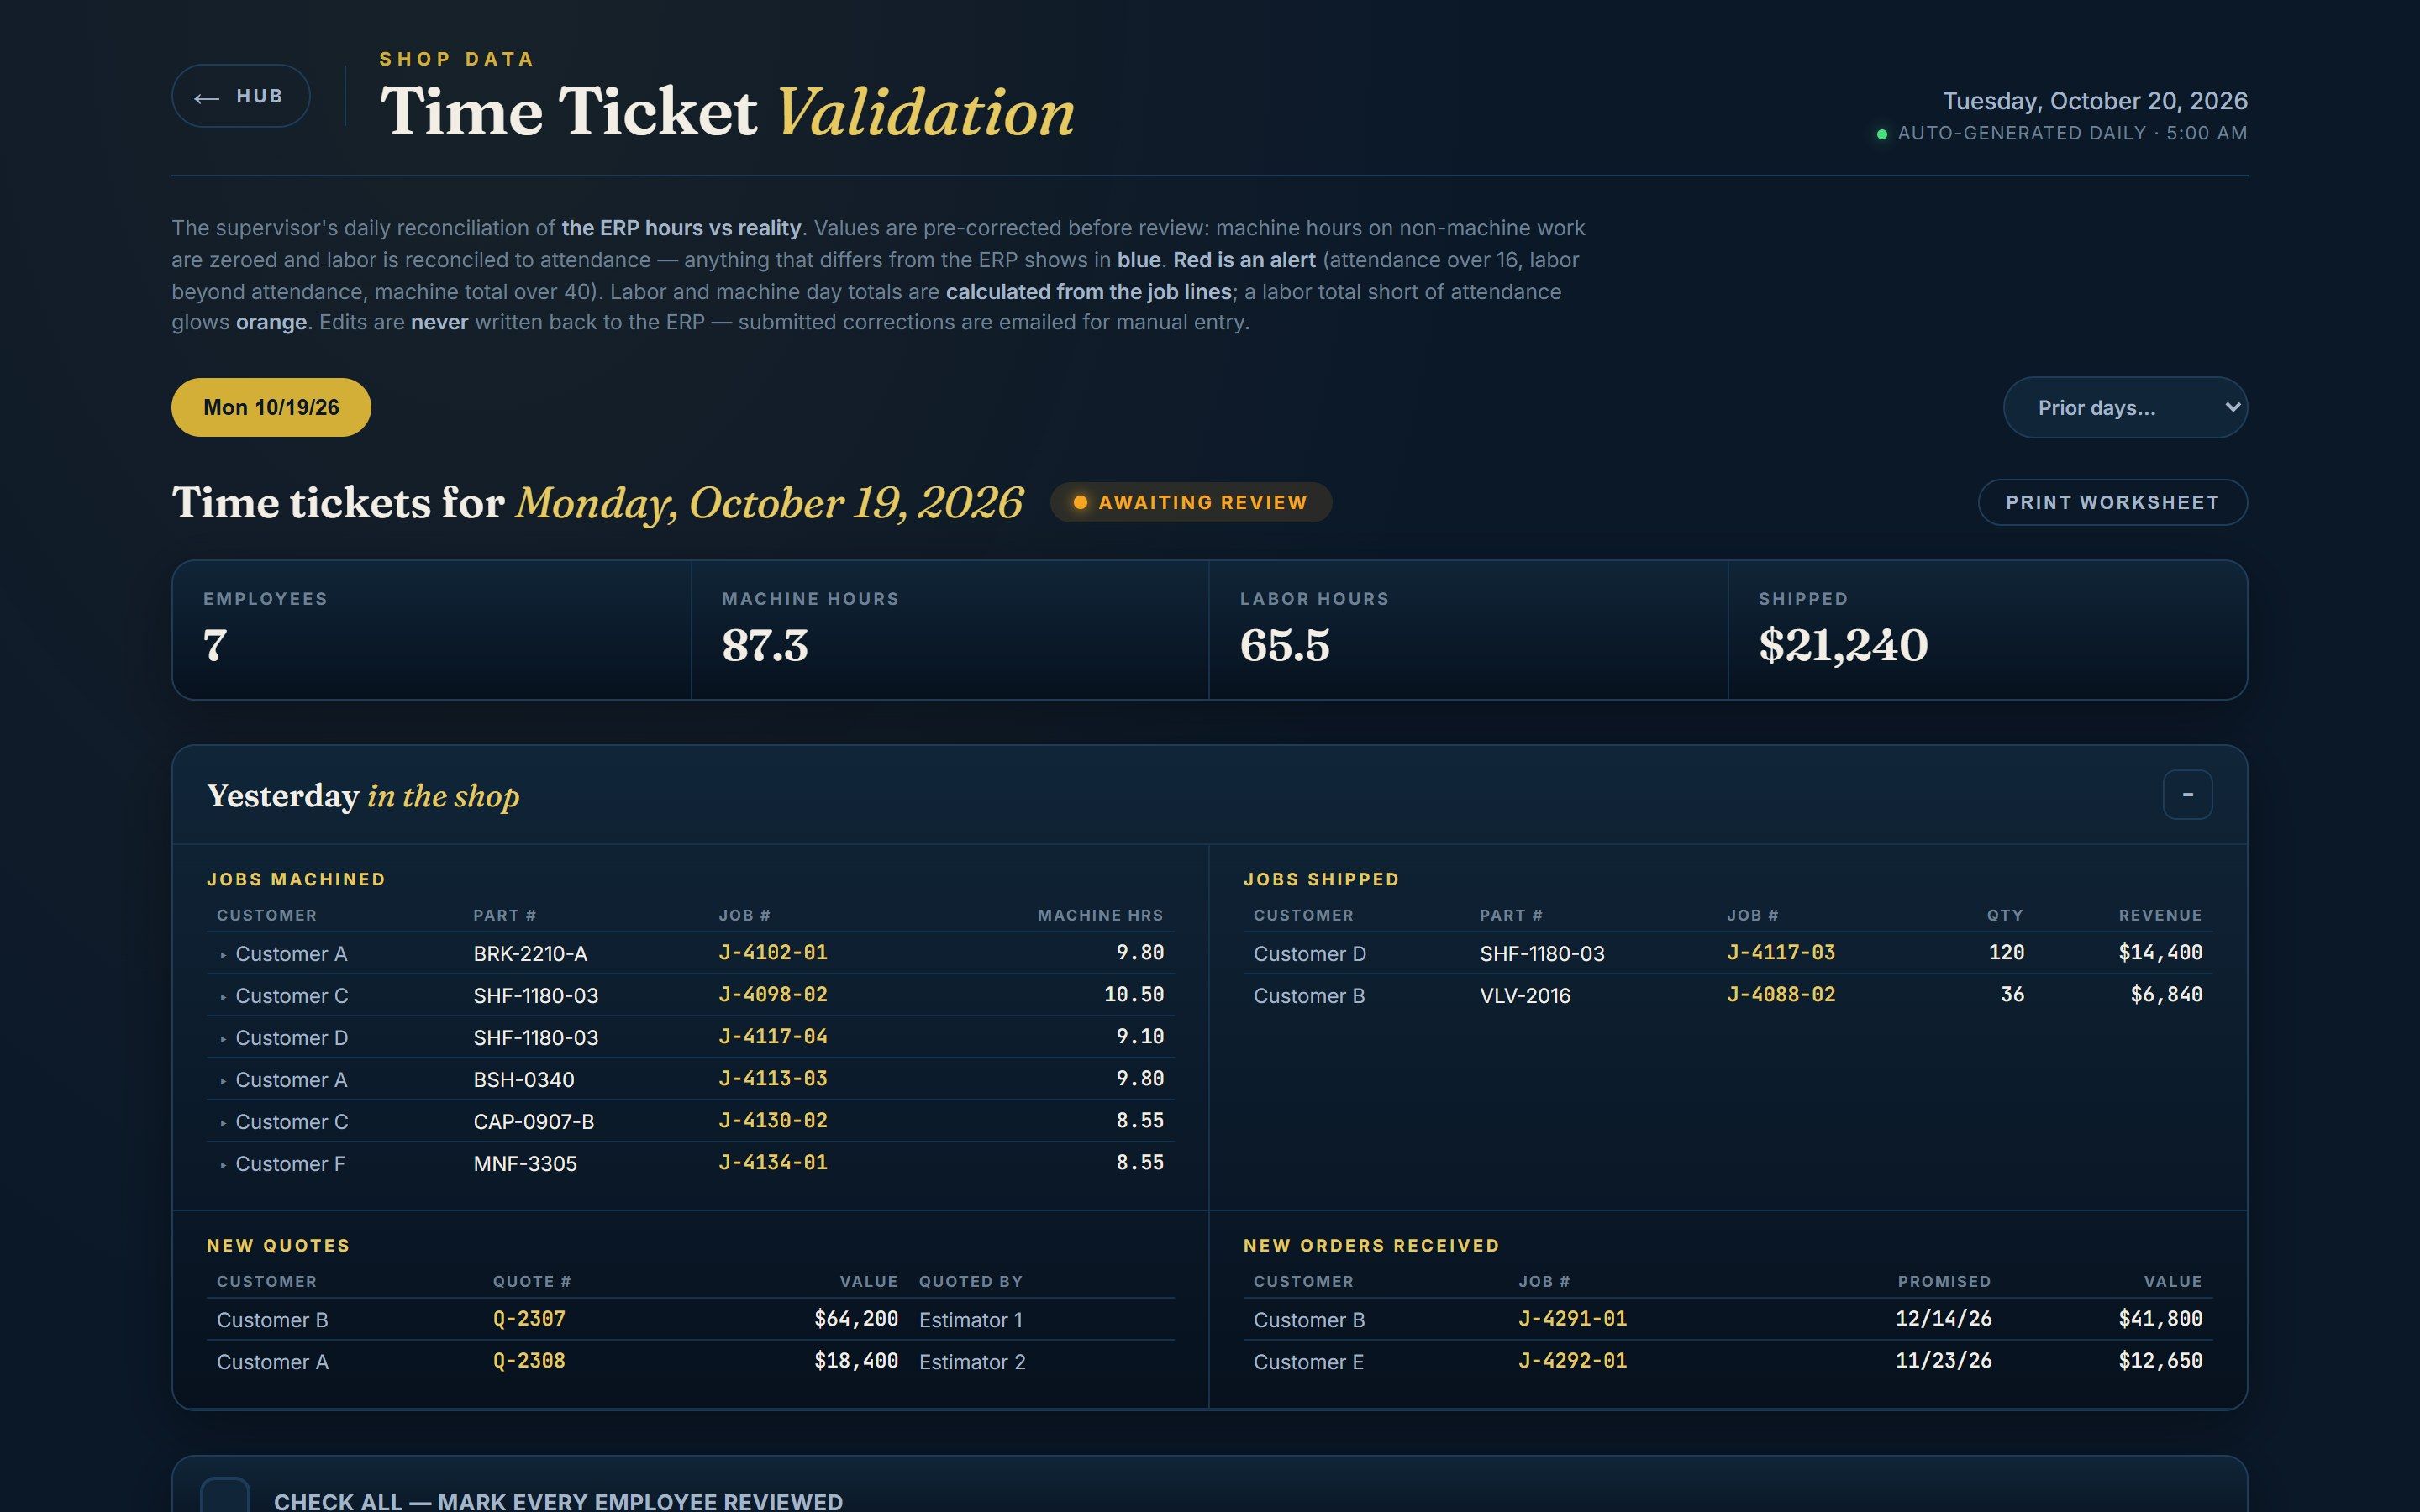
4.1 Yesterday's tickets become a review form every morning. Labor is reconciled to attendance and the supervisor signs it off; the ERP is never edited automatically. Image -
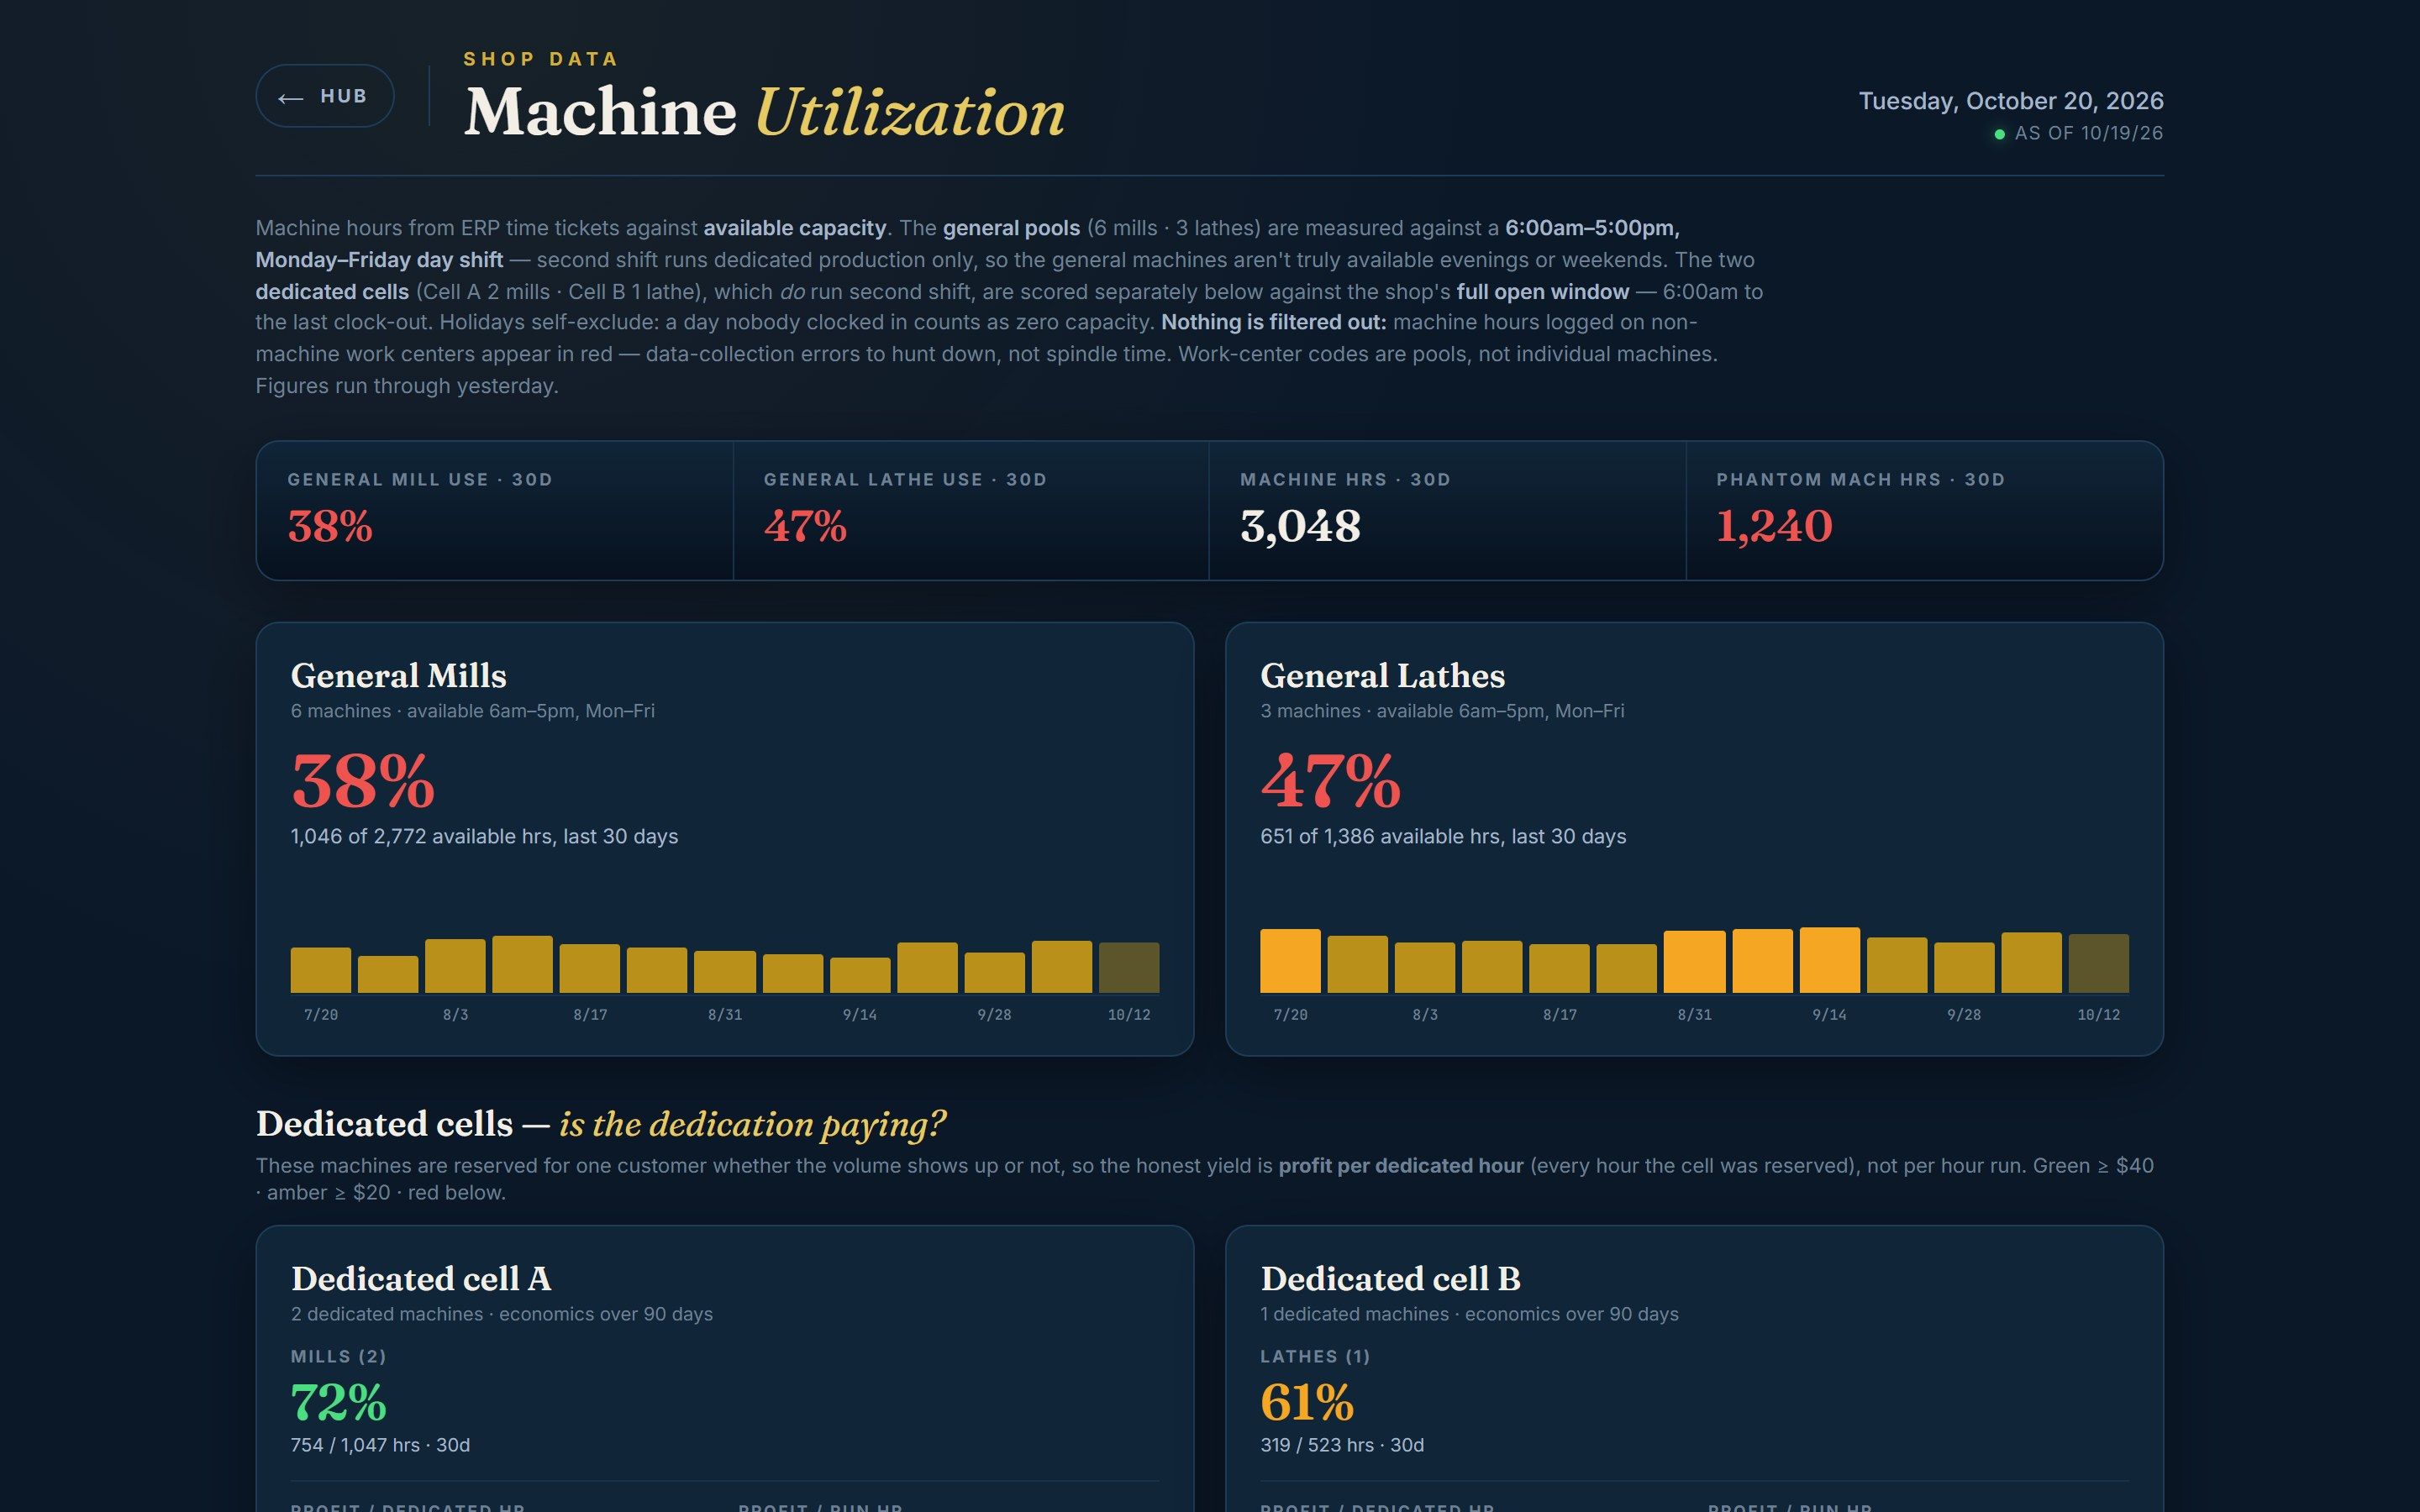
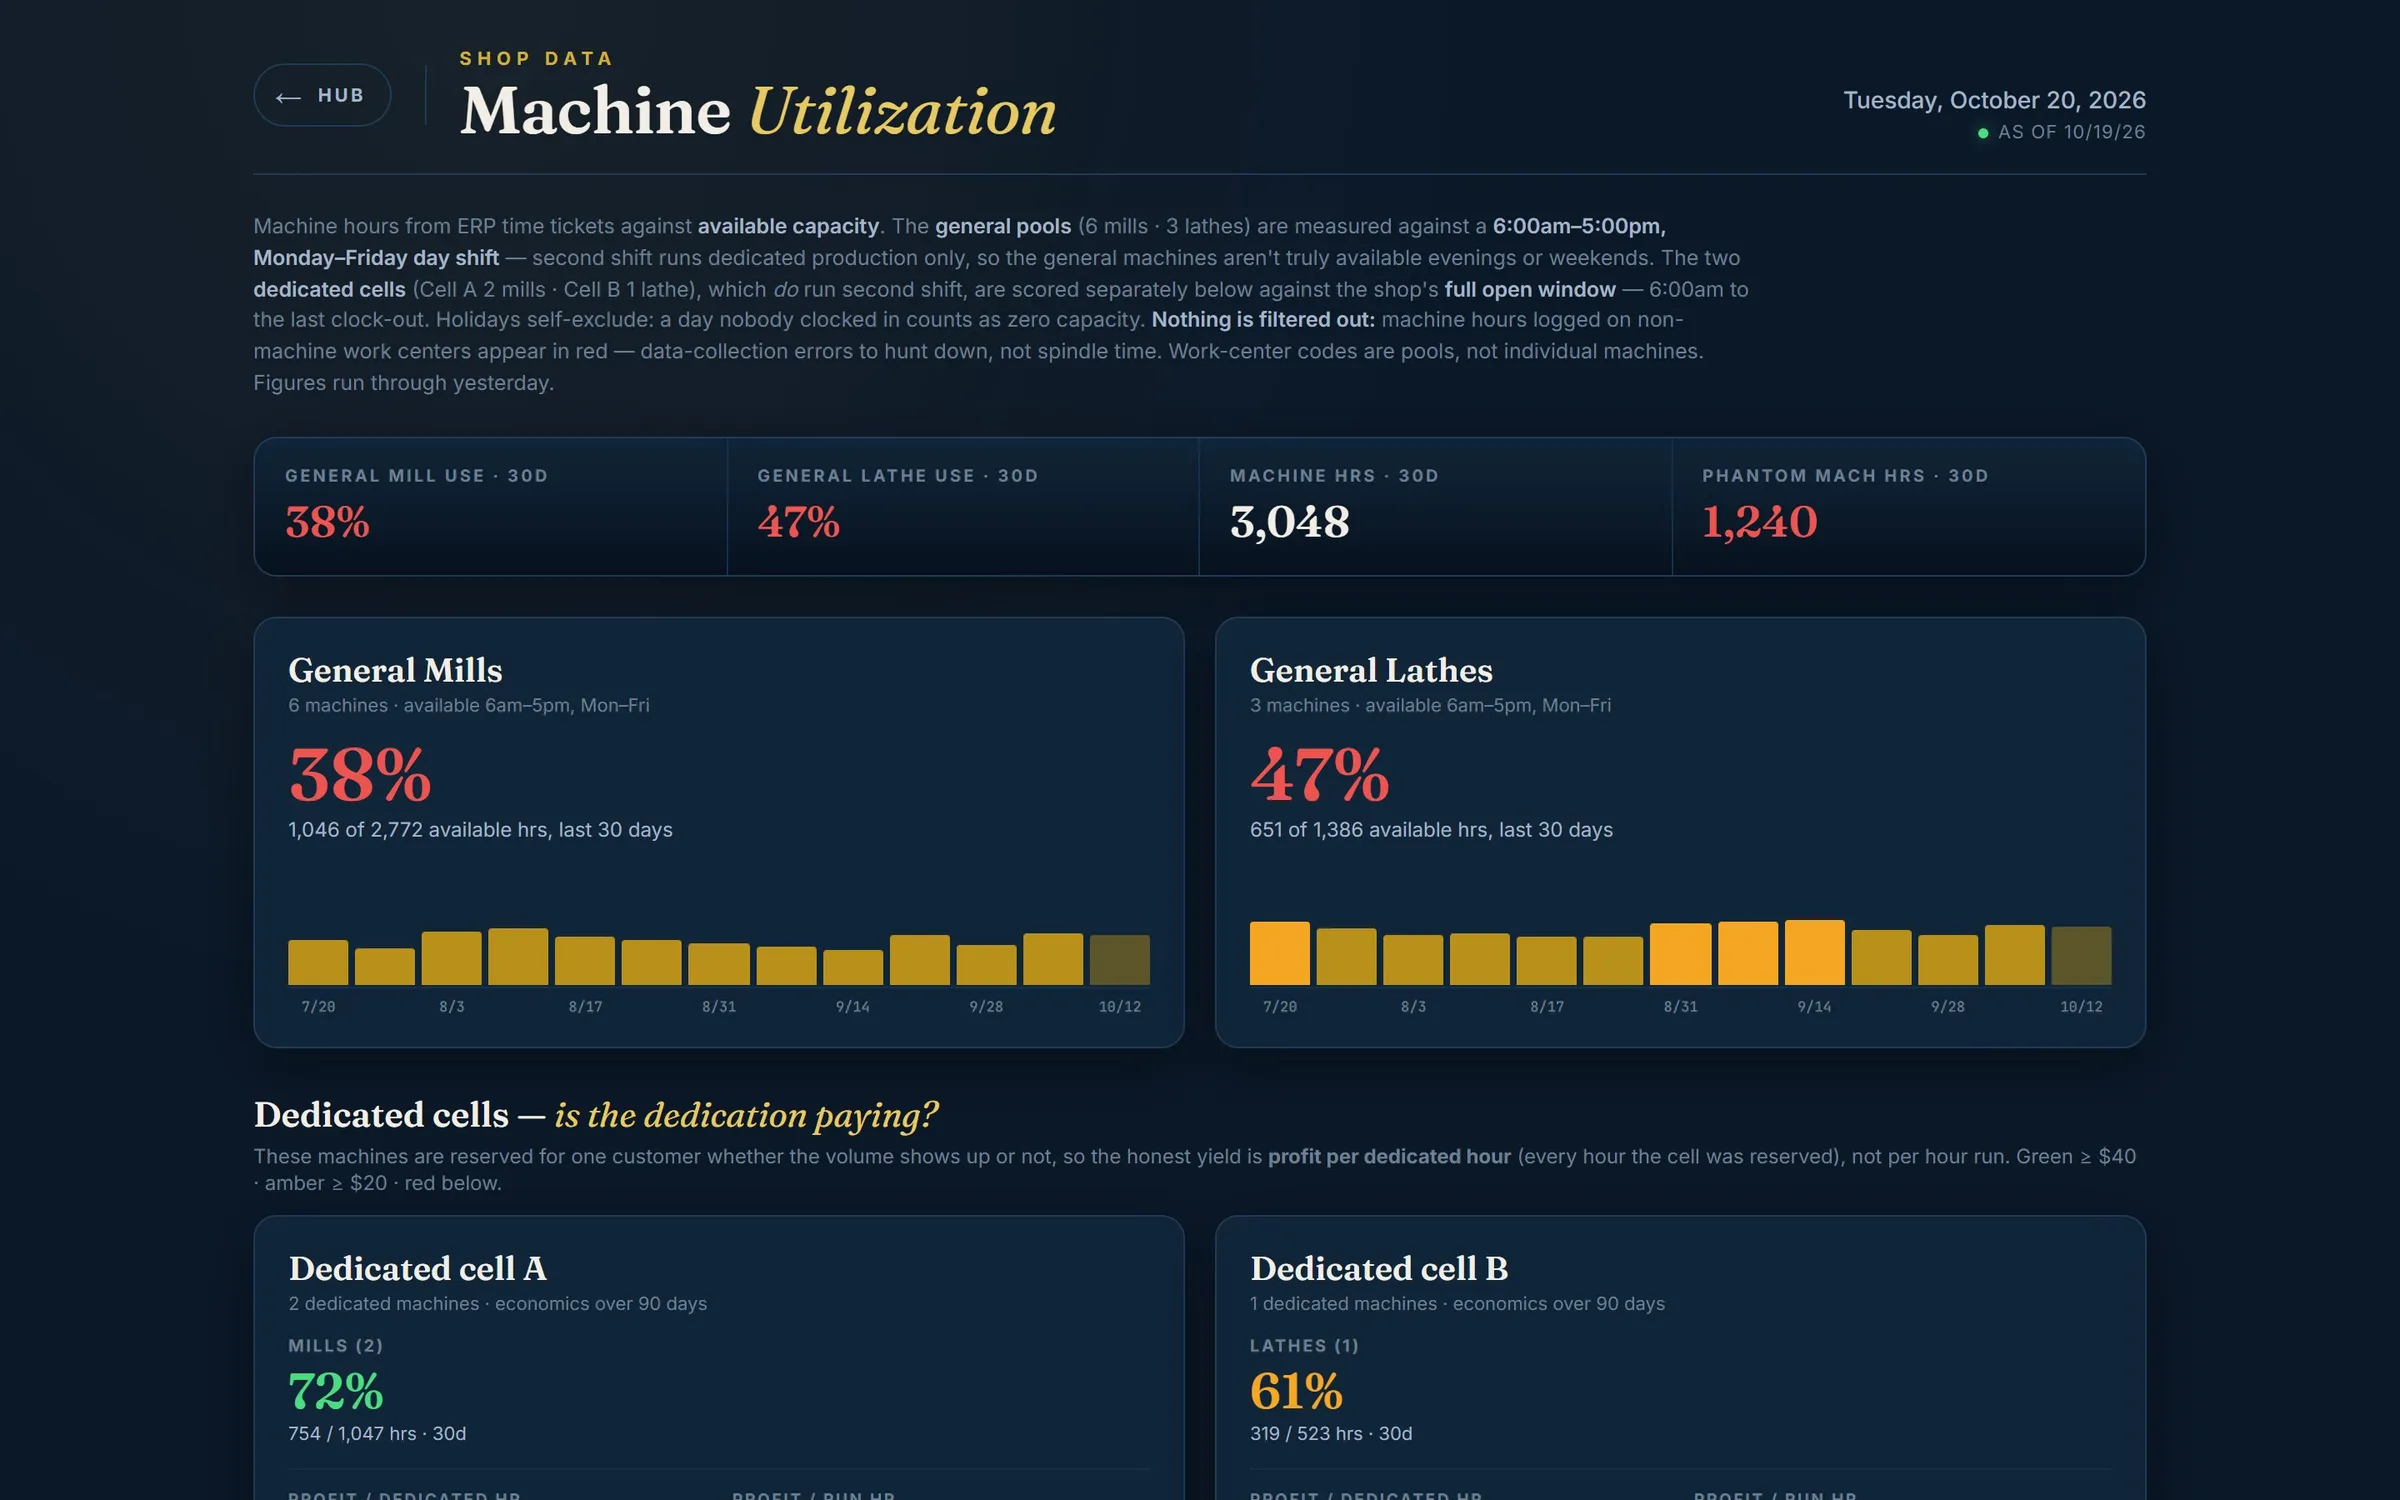
4.2 Capacity measured against the shifts the machines actually run, with phantom machine time named so it can be fixed. Image -
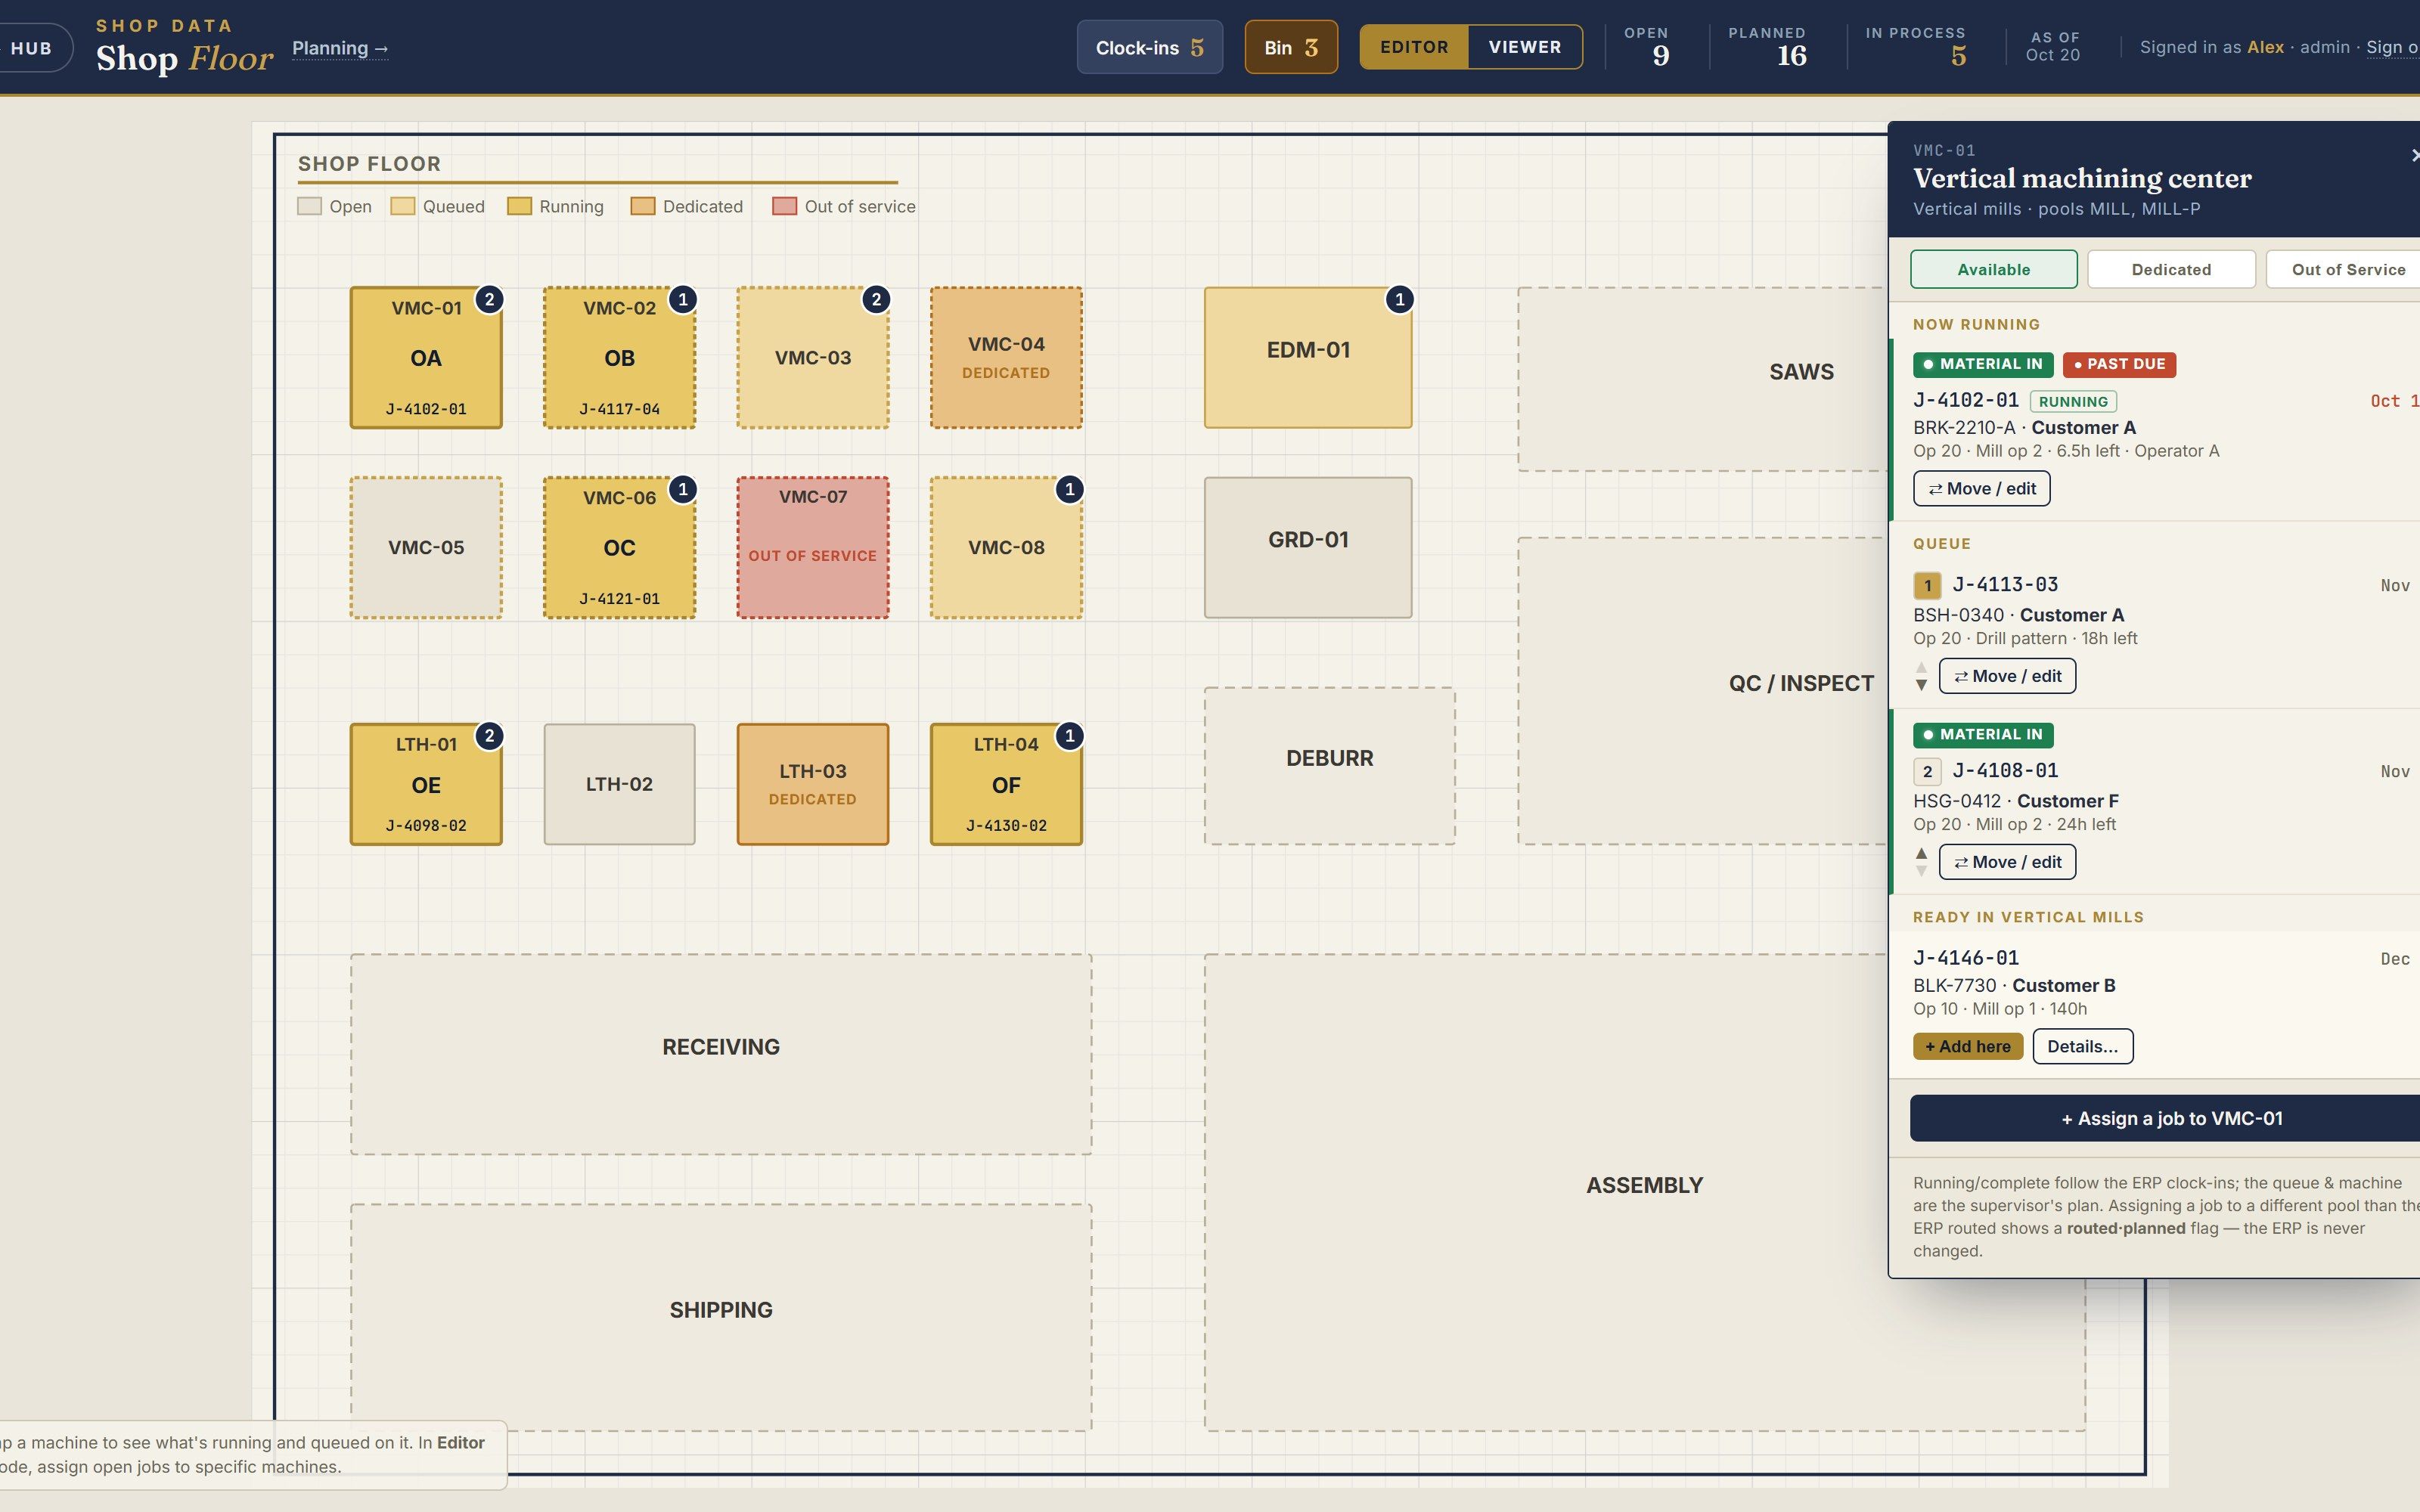
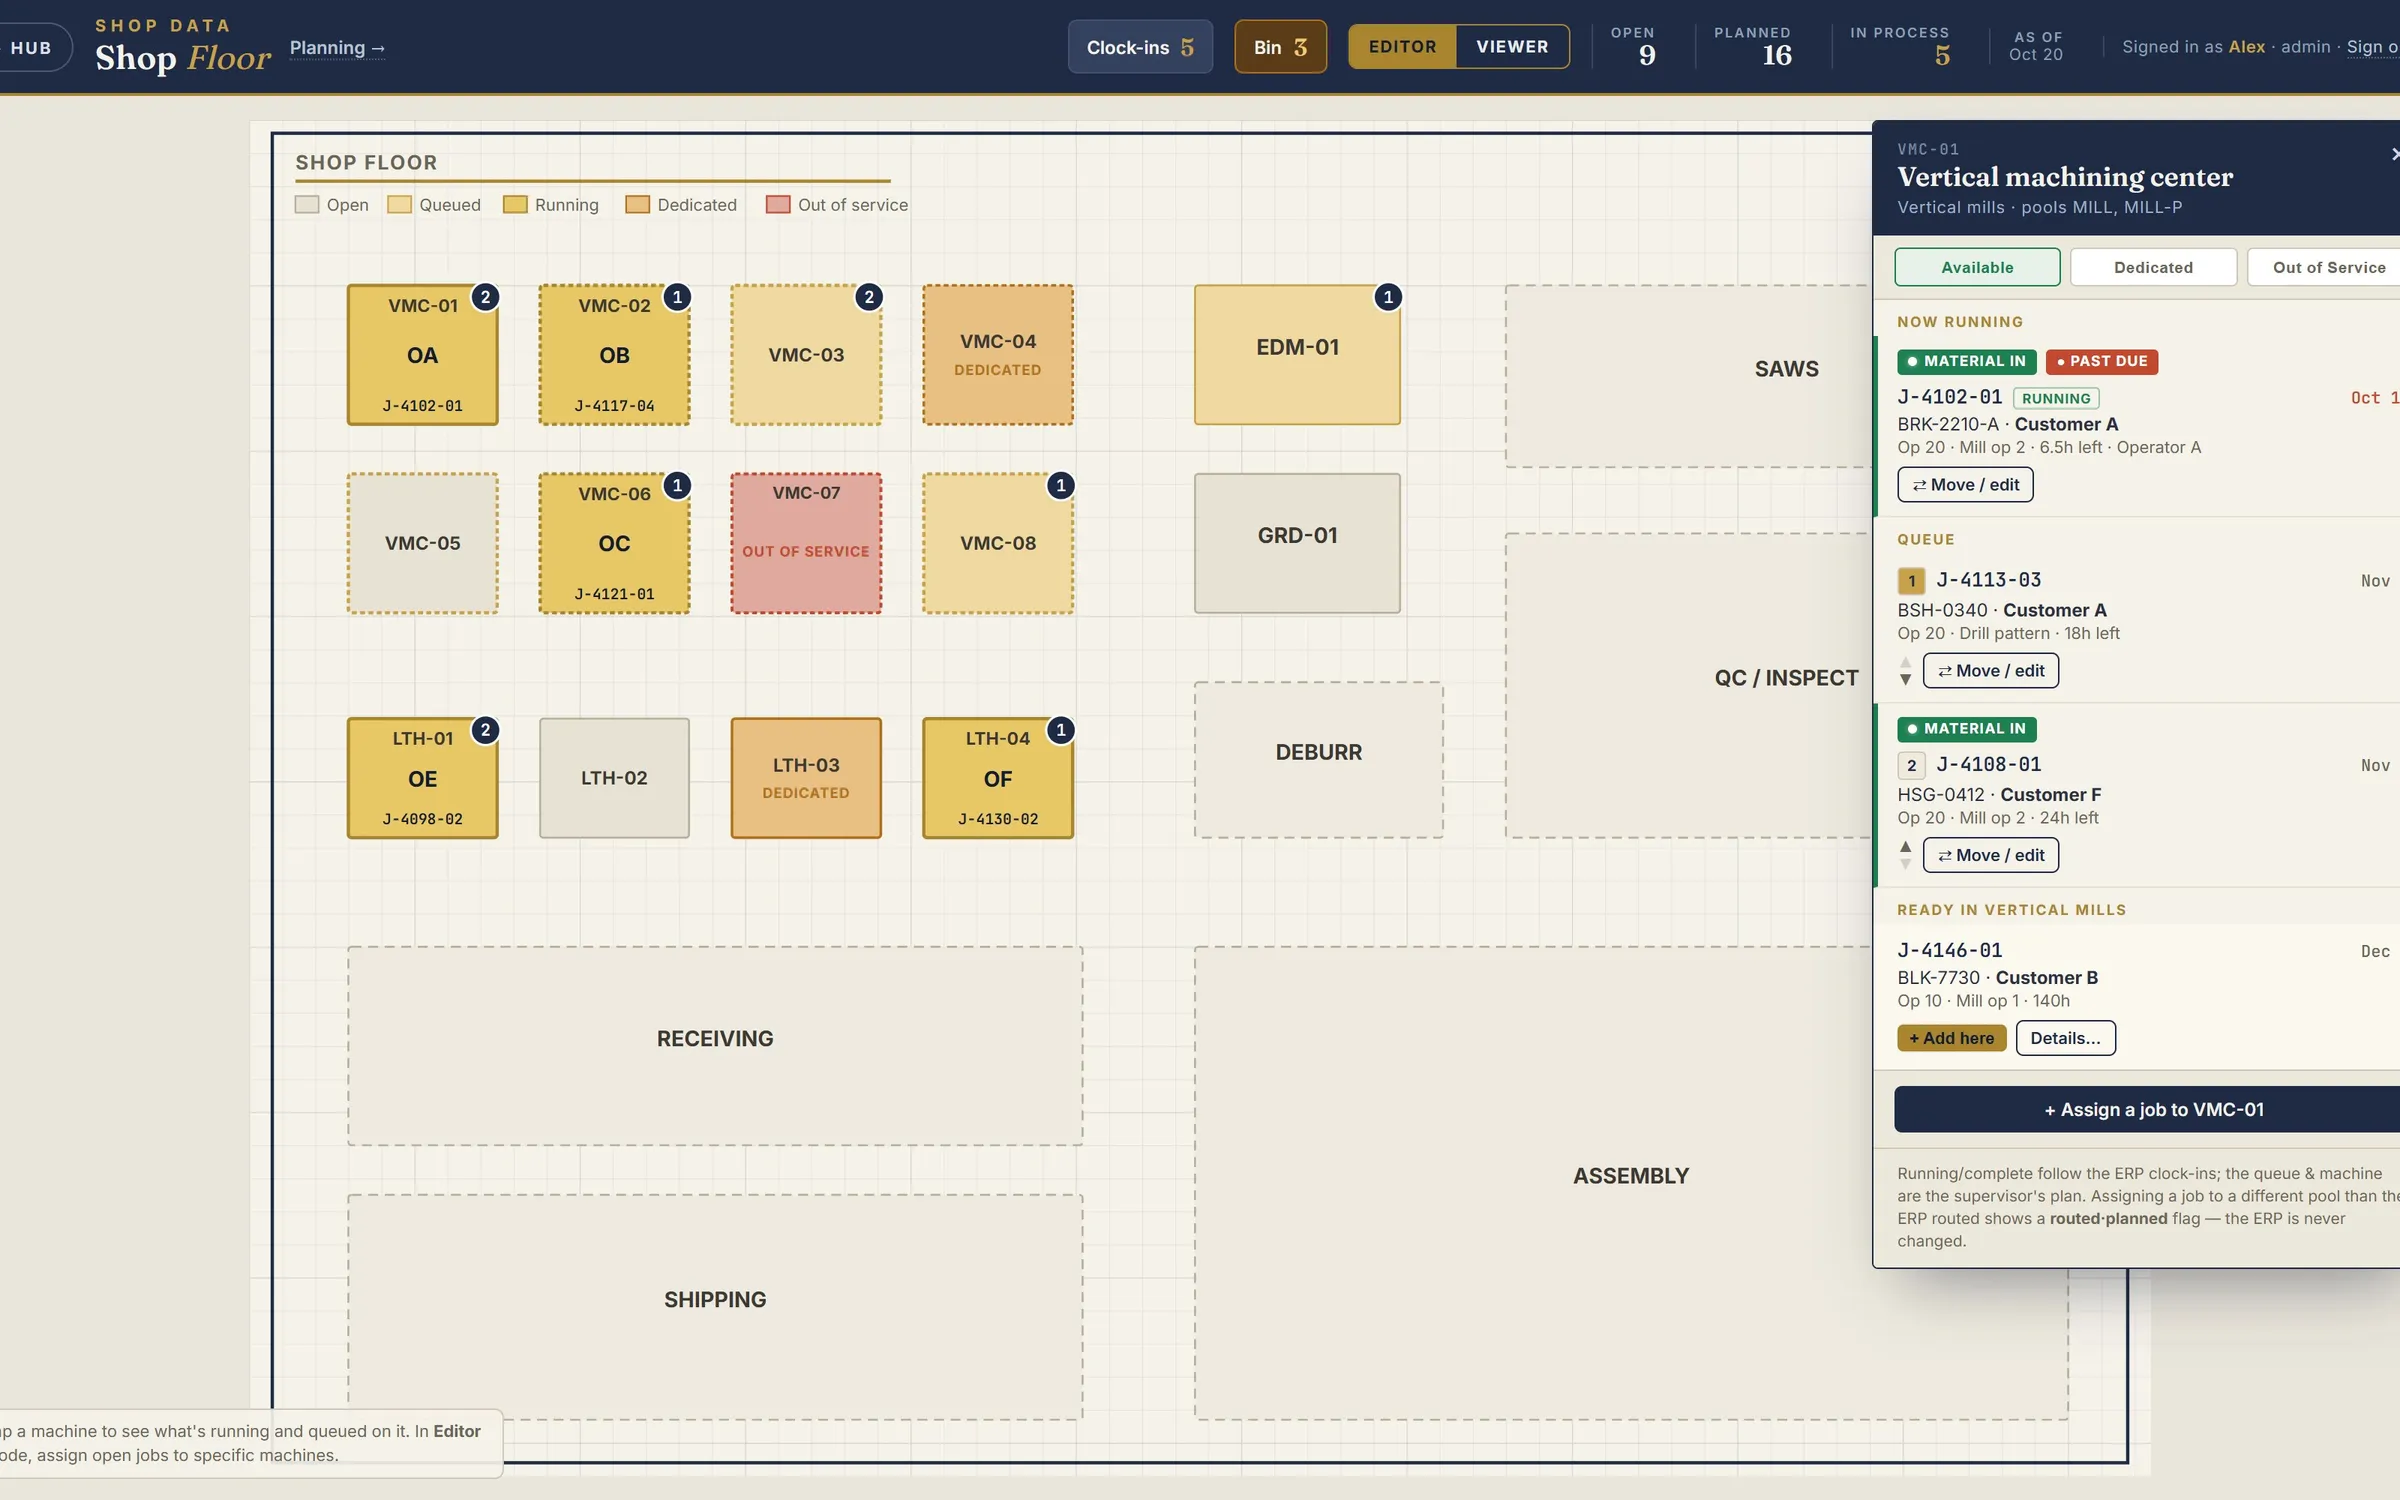
4.3 The floor plan, refreshed every ten minutes from clock-ins. Who is running what, and what is queued where. Image -
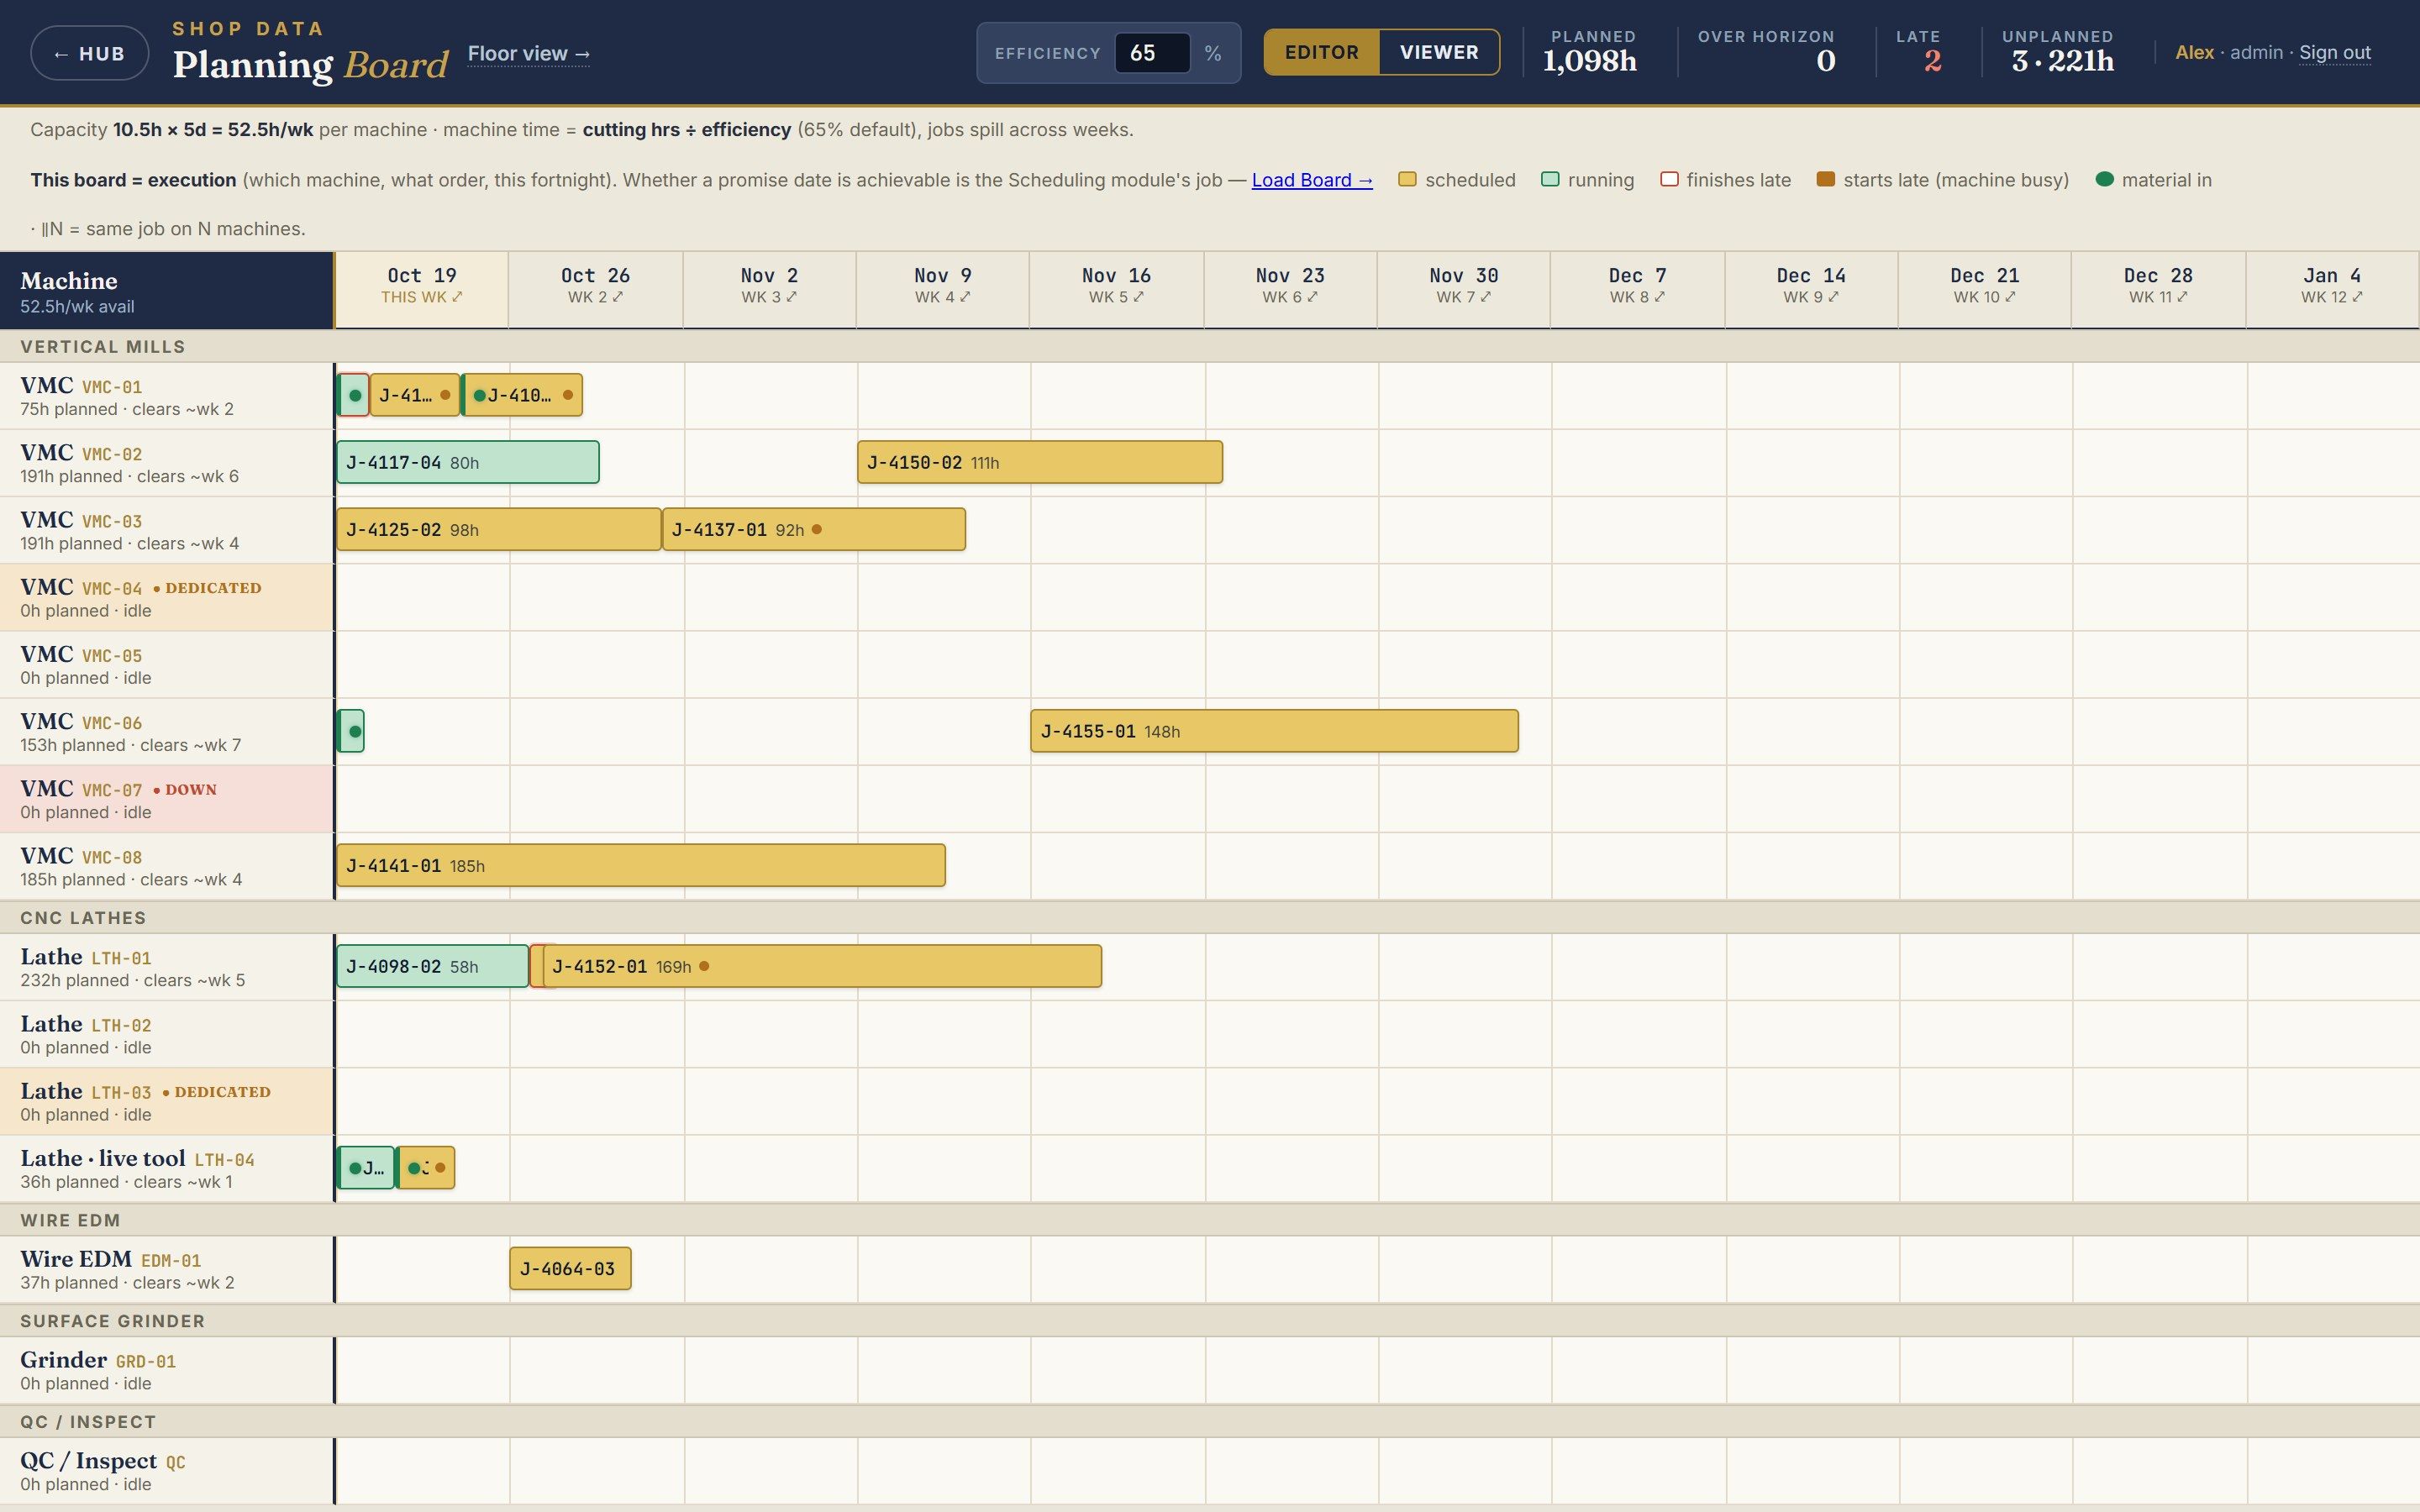
4.4 Jobs laid onto machines by week, with due-date conflicts and material flags, so "are we at capacity" has a number instead of a feeling. Image -
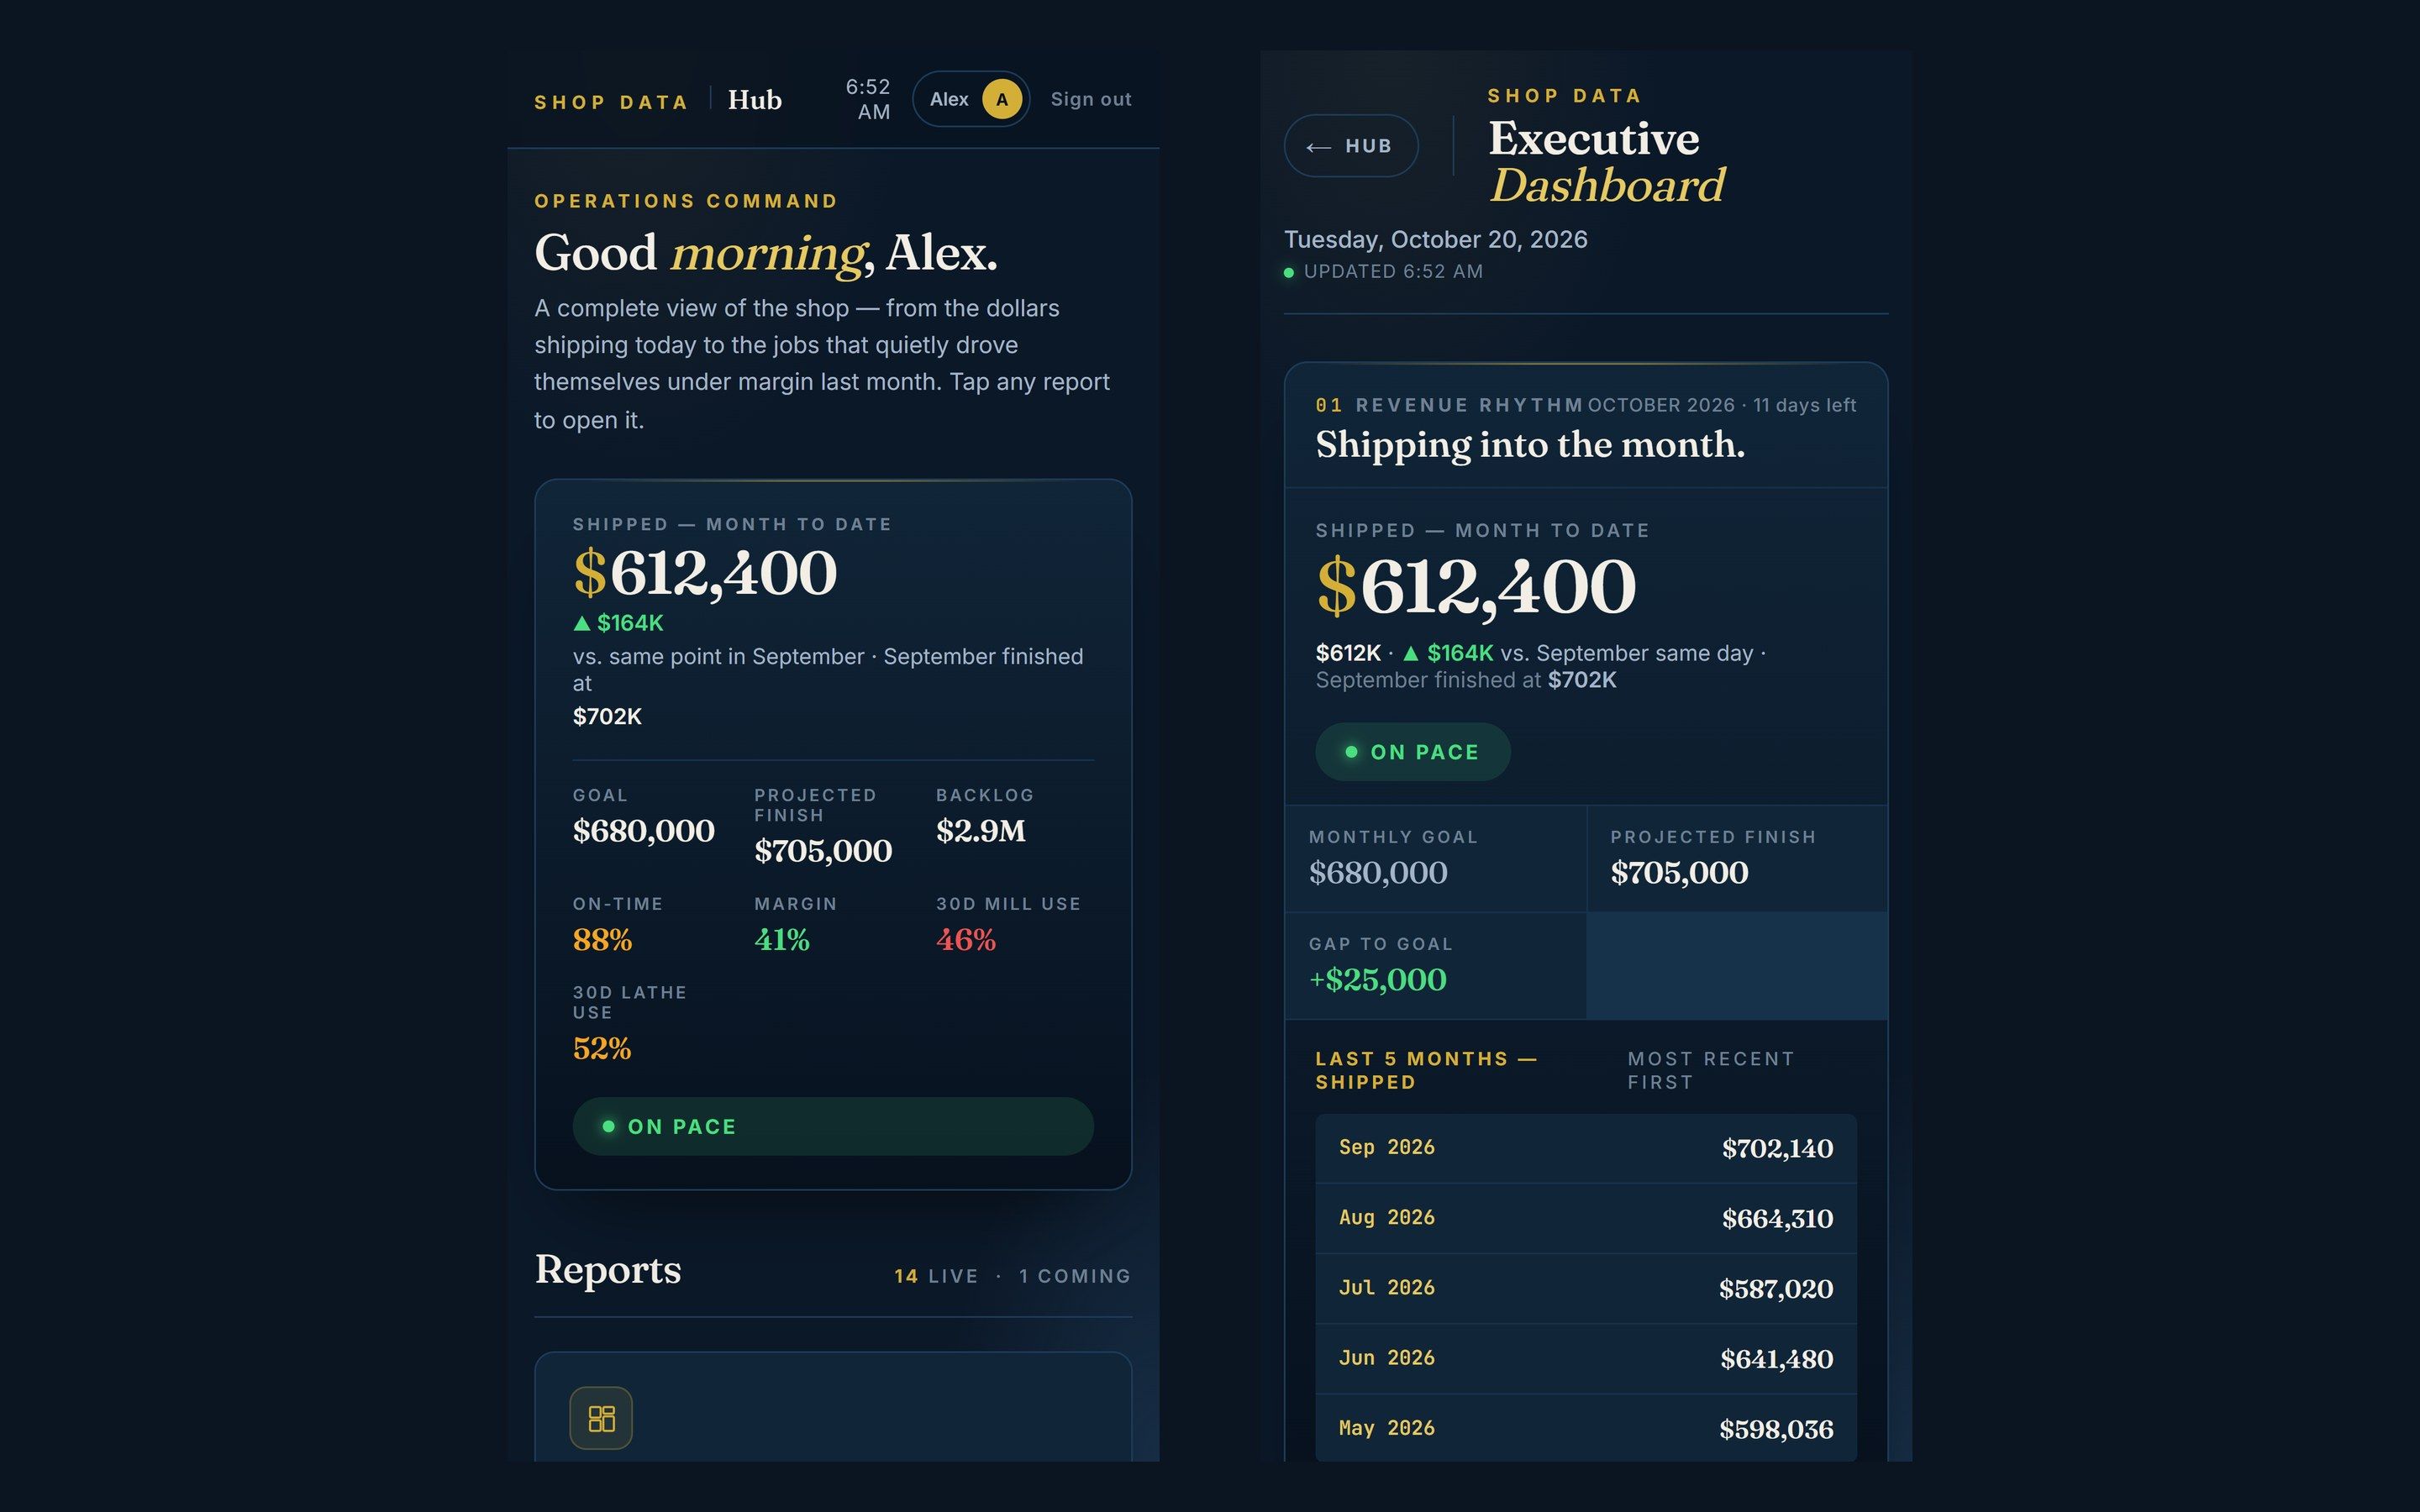
4.5 The same numbers on a phone, behind a personal login. Image