FloorSignal: a near miss reported in thirty seconds, fixed in the open
Concept Specified and mocked up, not yet deployed. Every plant, person, and figure in the screens is fictional.
- Role
- Concept and interface design
- Year
- 2026
- Tools
- Concept deckInterface mock-ups
Overview
A QR code on every machine opens a phone form; reports land on a triage board with an owner and a due date, and the floor sees what was fixed.
Problem
Most near misses are never written down, because writing one down takes longer than the near miss did.
The form lives in an office or on a clipboard, it asks who was involved, and nothing visible happens afterwards. So the hazard that almost hurt someone on second shift is still there on third, and the only record of it is a conversation. Safety programs then measure what did happen, because nothing was captured about what almost did.
Approach
Make the report faster than the walk to the supervisor, give every report a named owner and a due date, and show the floor what was fixed.
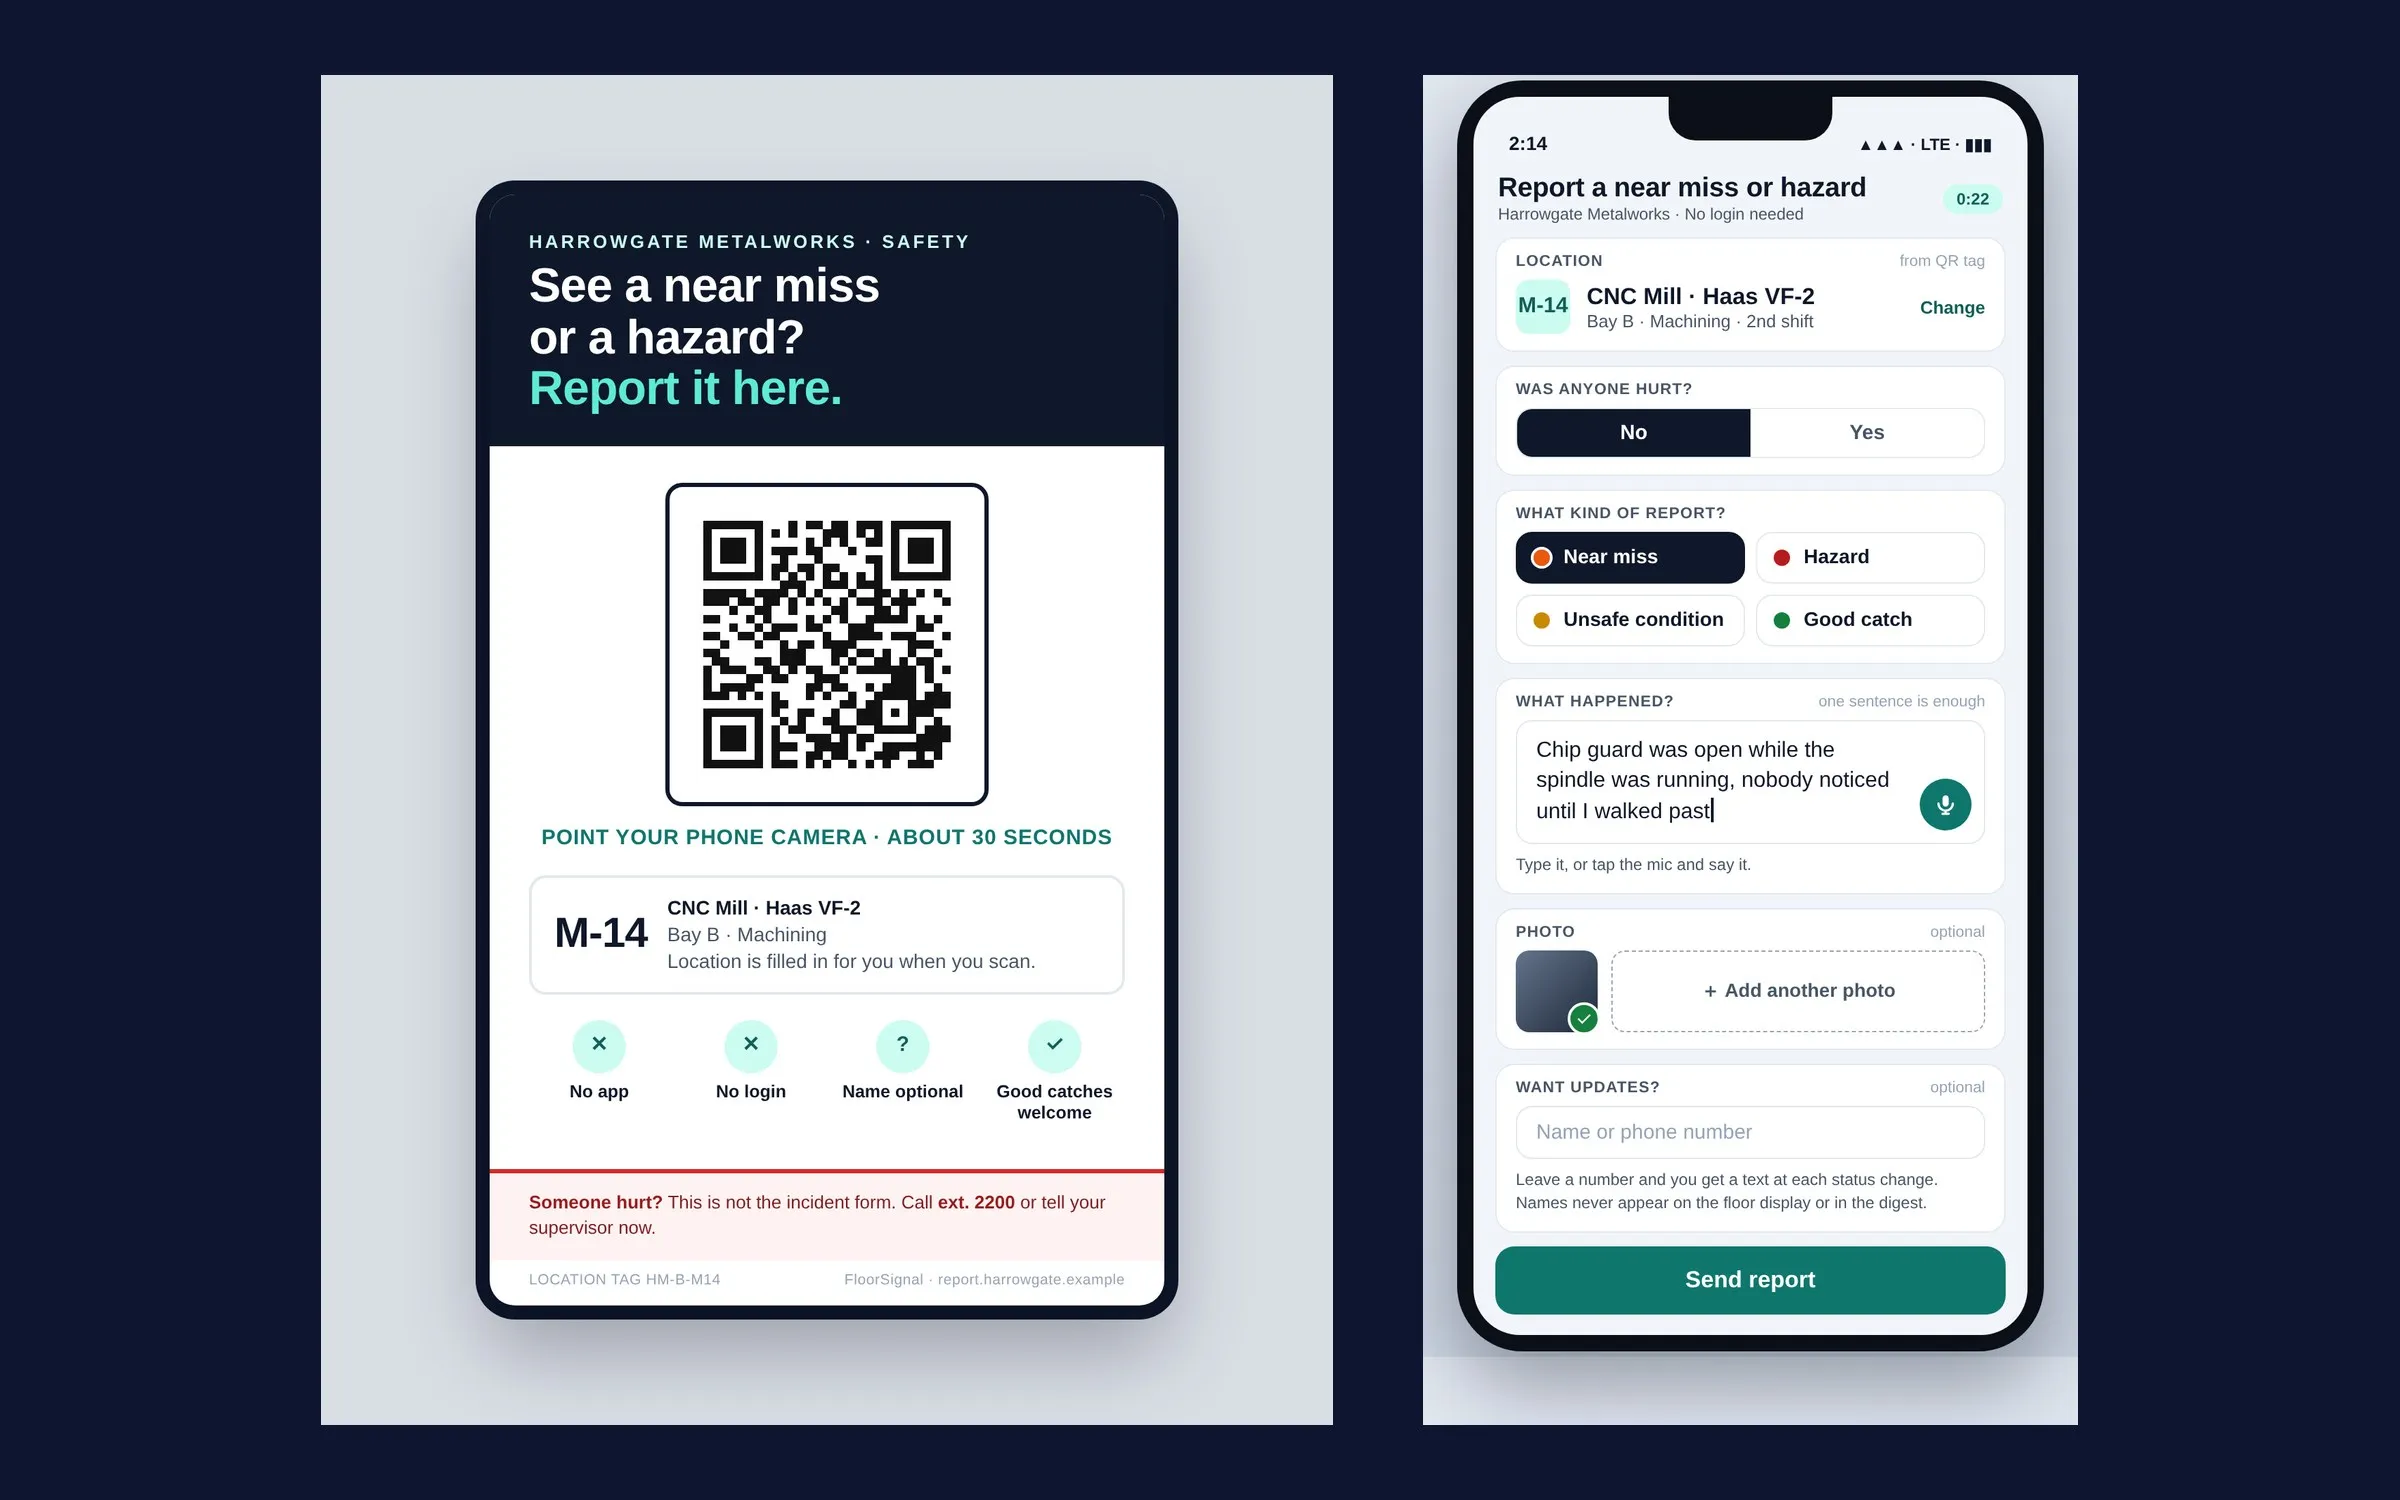
A QR tag on every machine, aisle, and dock door opens a phone page with that location already filled in. No app, no login, name optional. The worker picks near miss, hazard, unsafe condition, or good catch, speaks or types one sentence, adds a photo, and sends. The form asks one question first: was anyone hurt? A yes routes to the incident process and the extension to call, because an injury needs care and an investigation, not this tool.
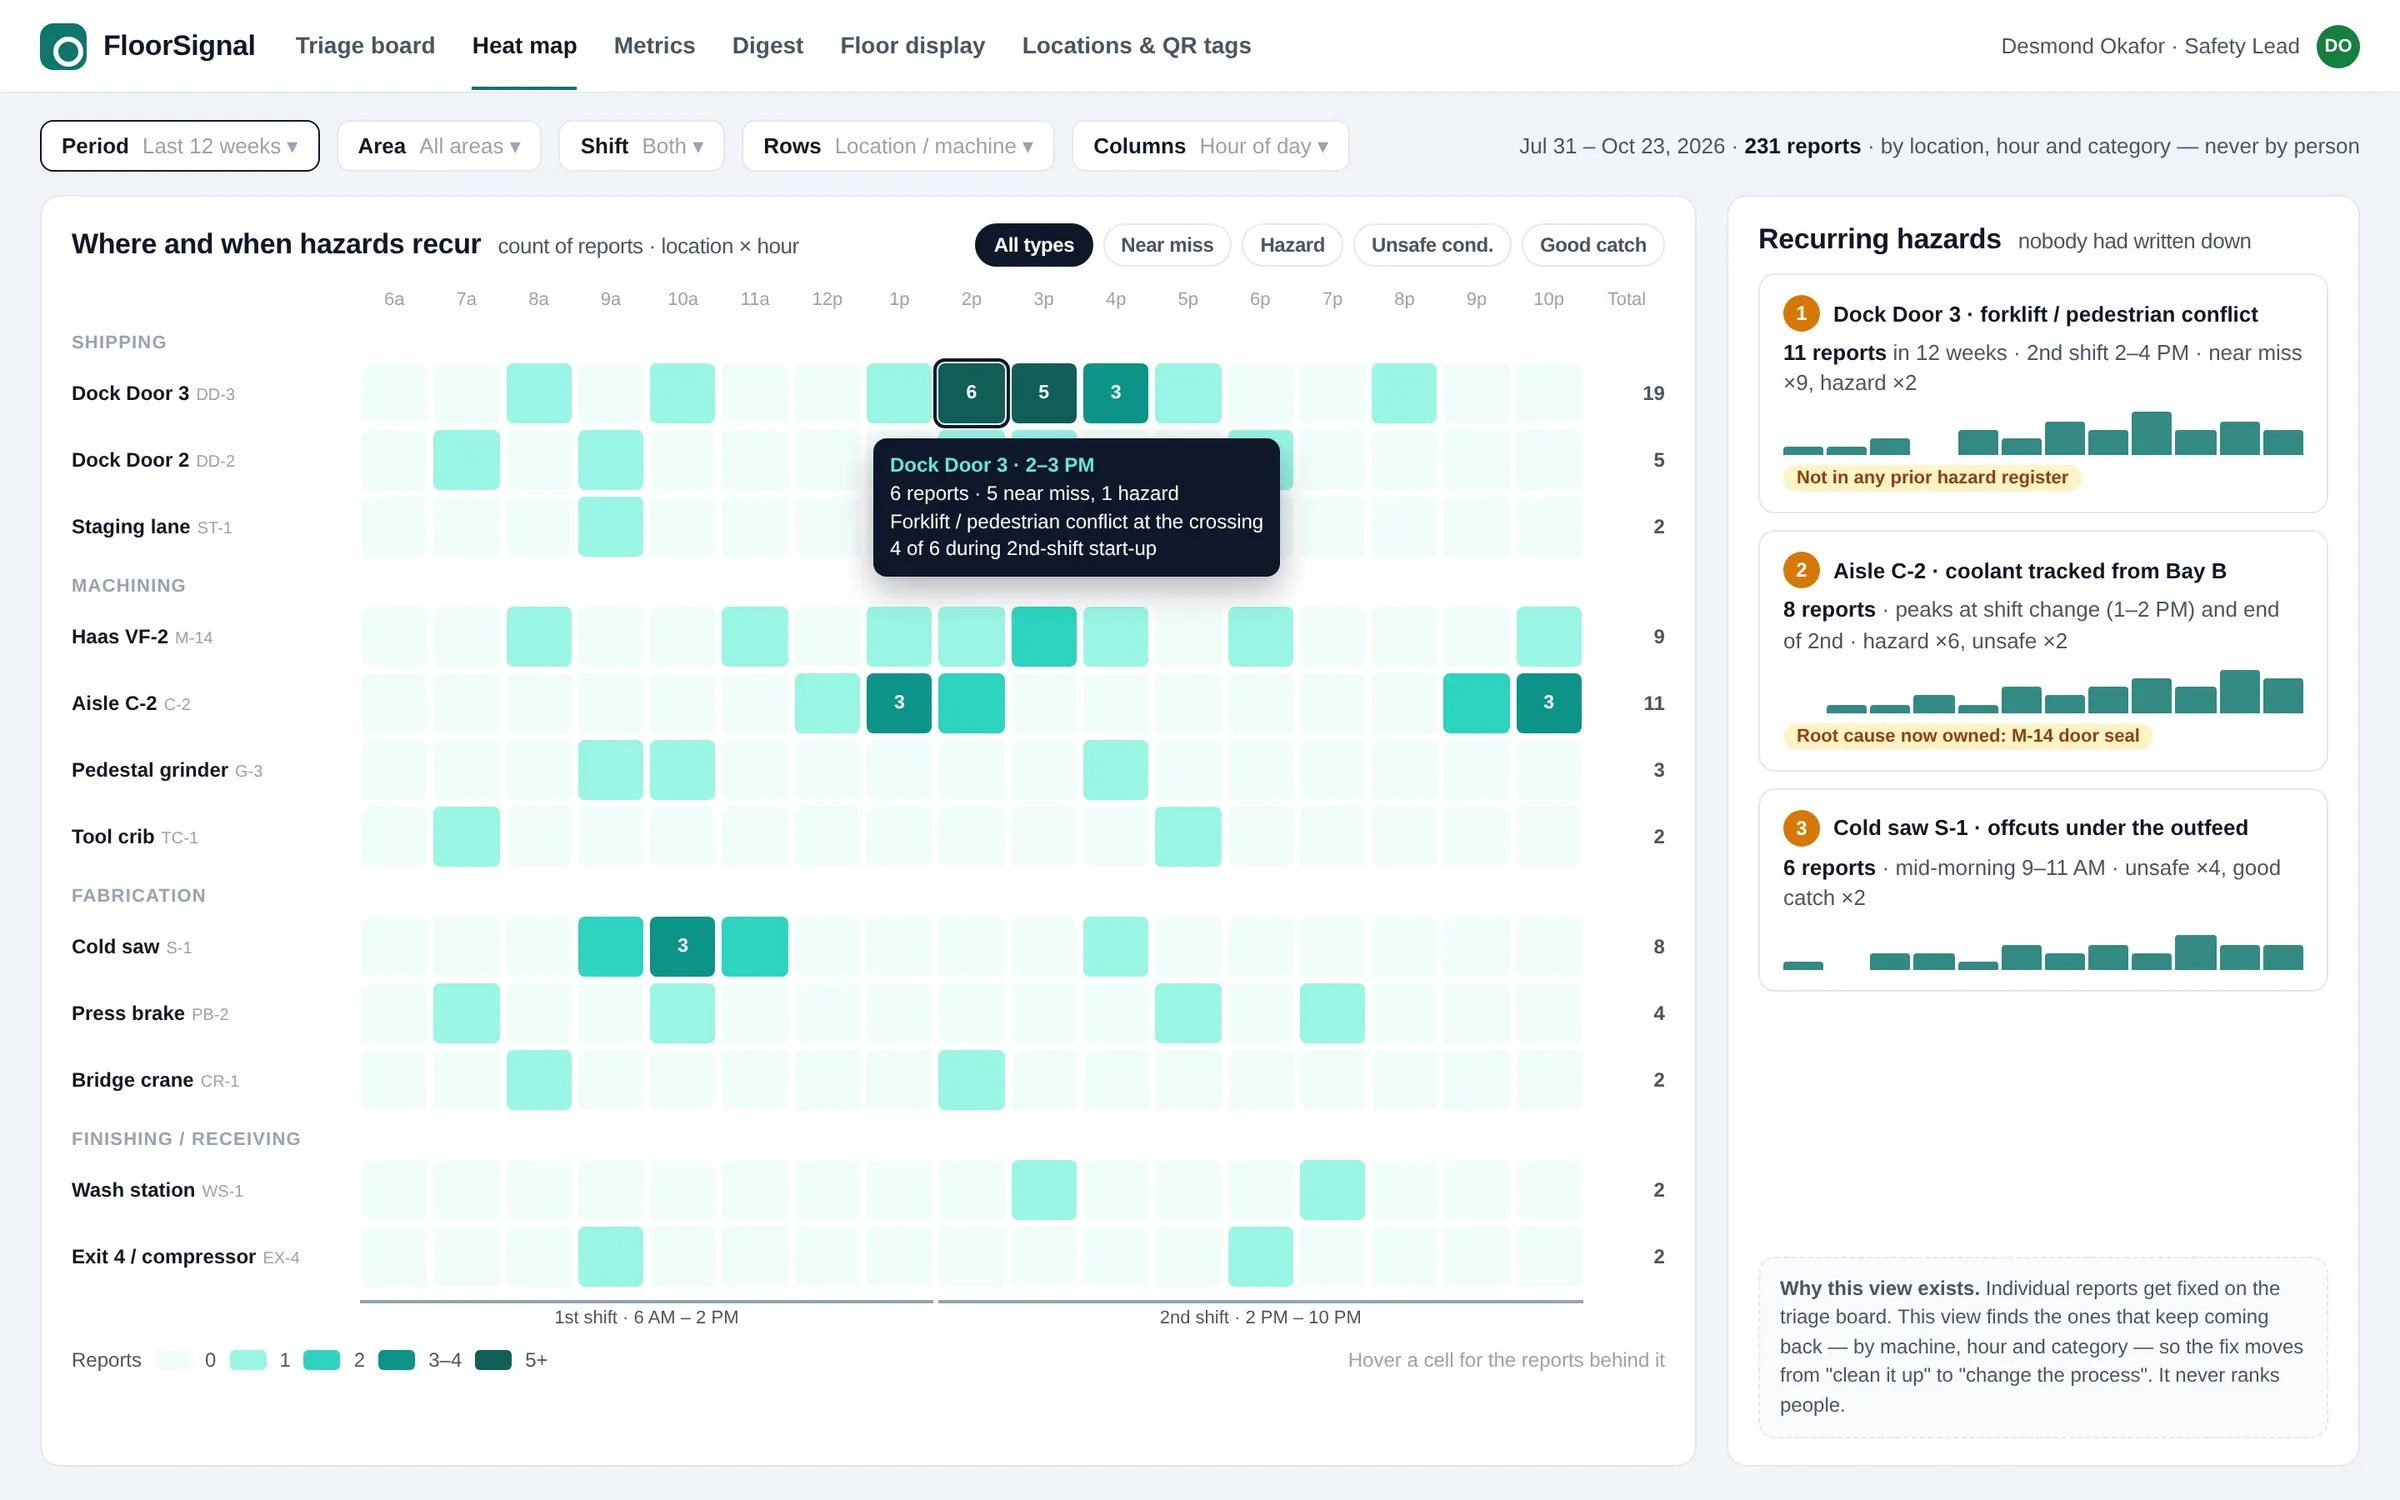
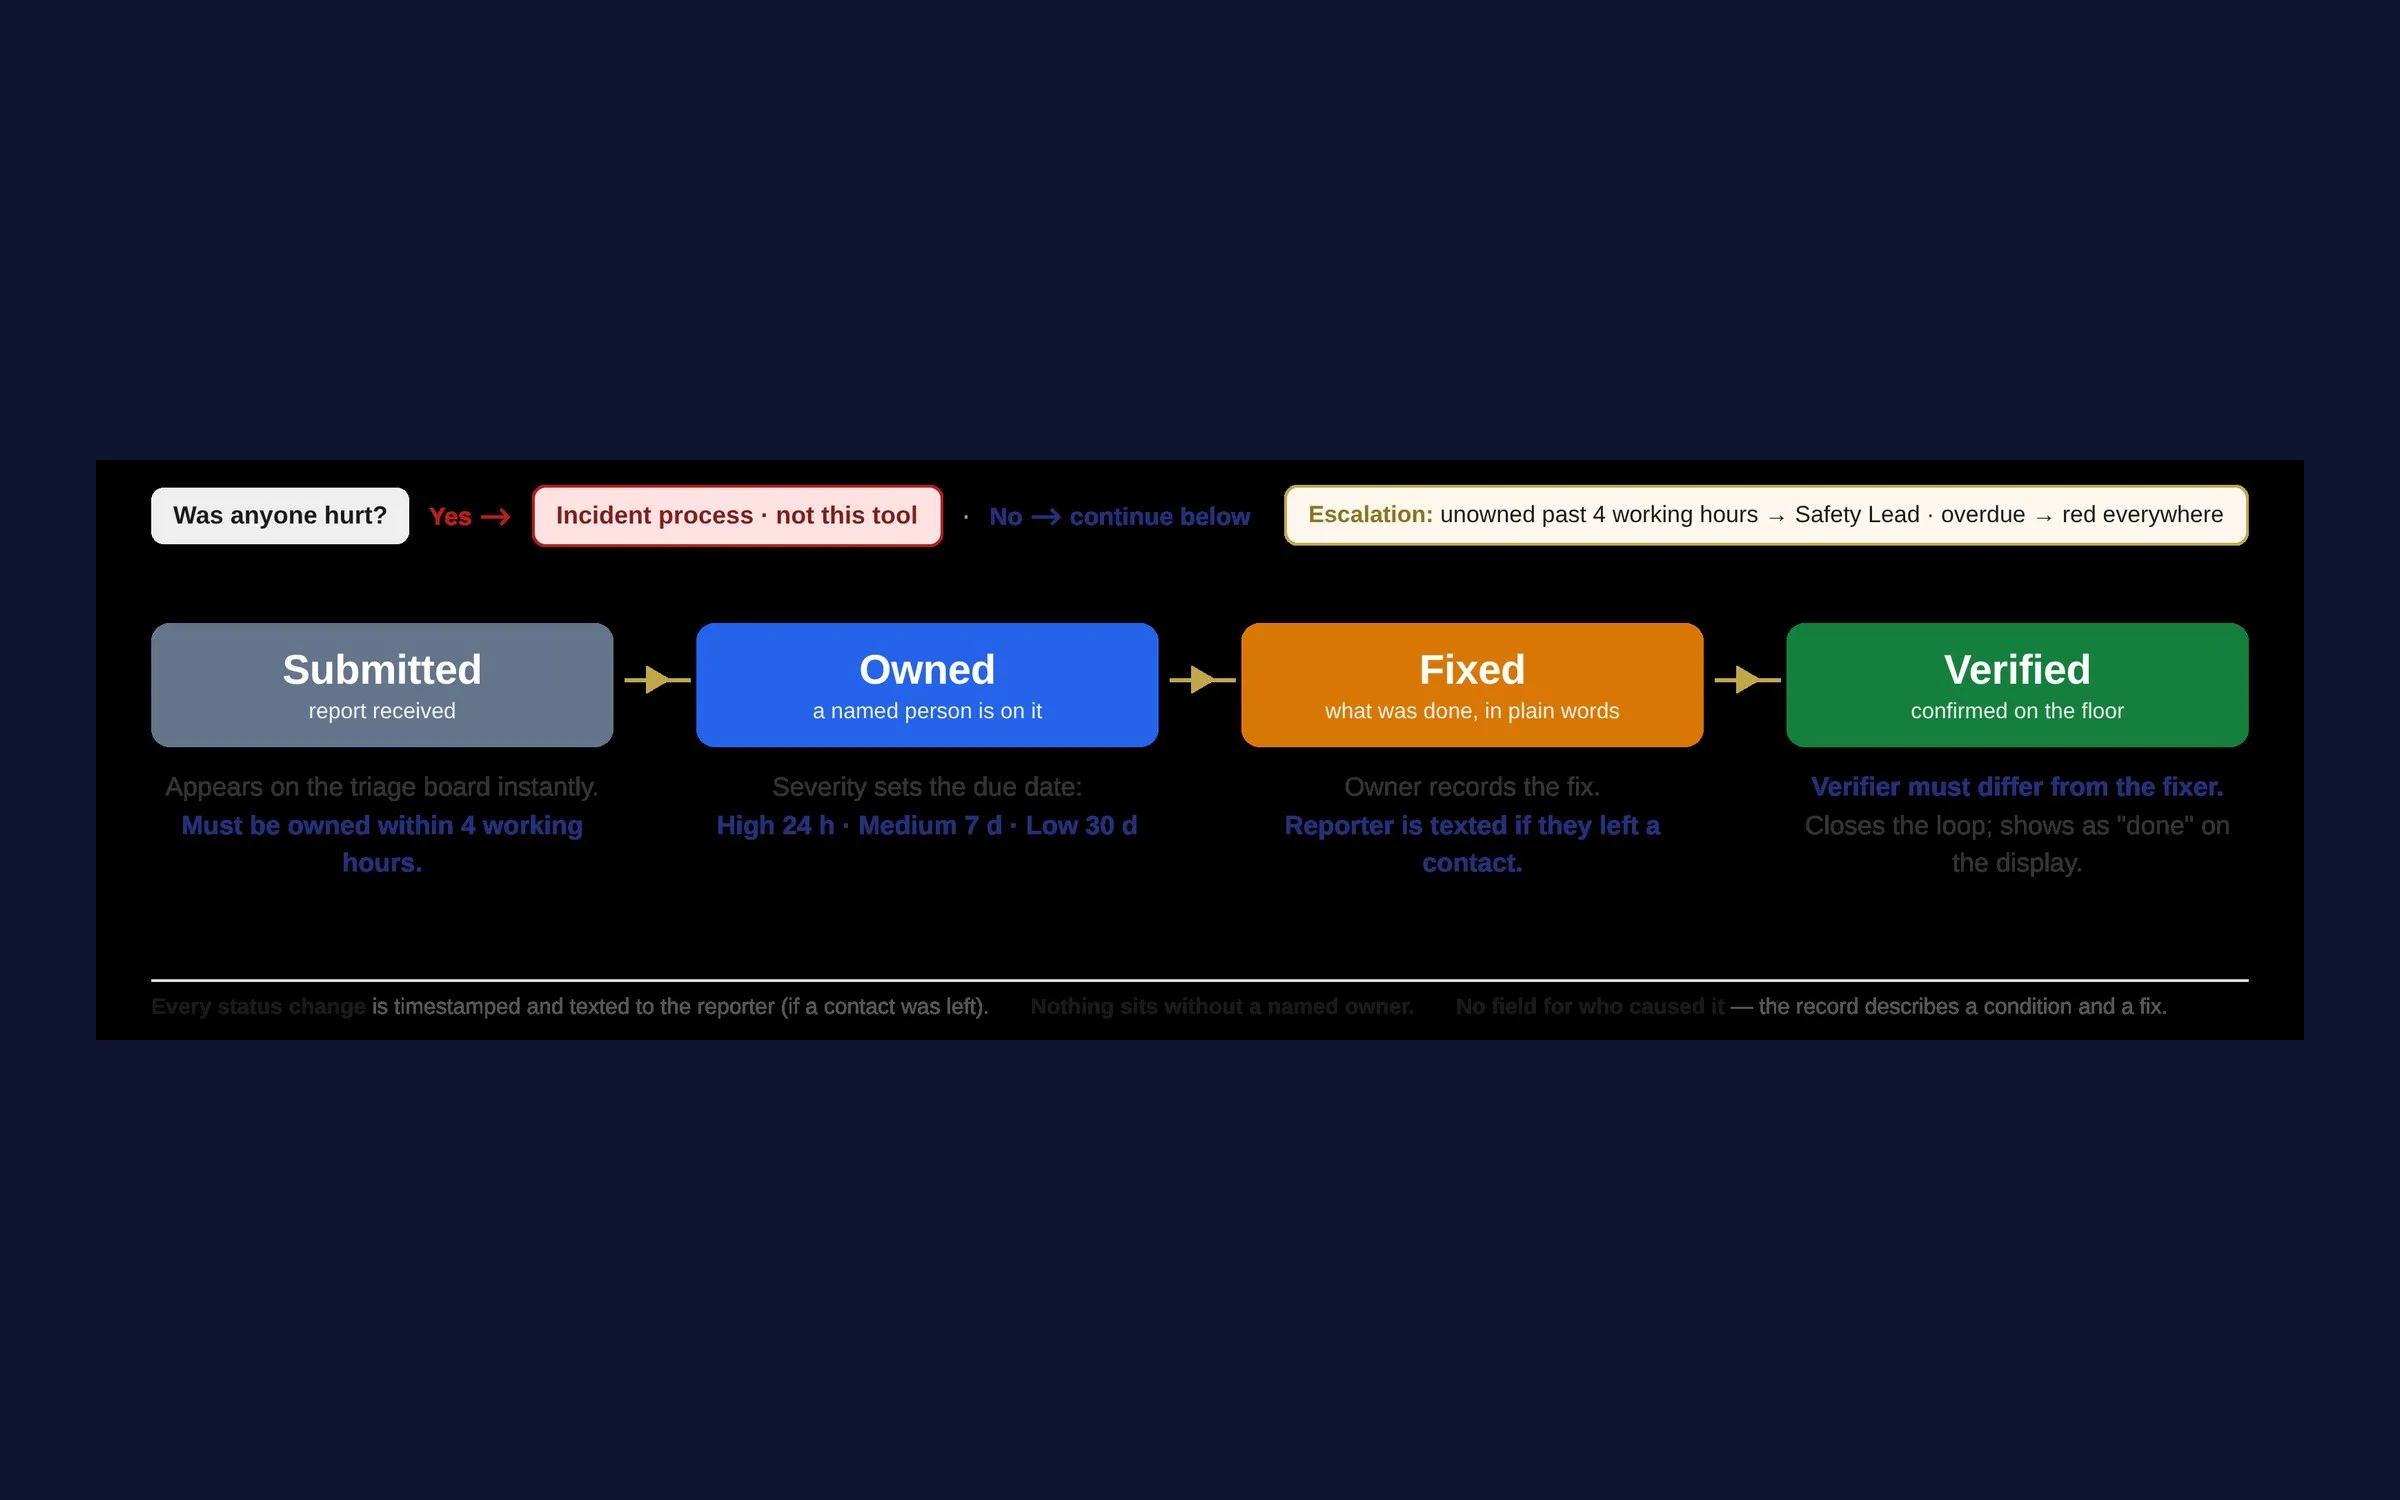
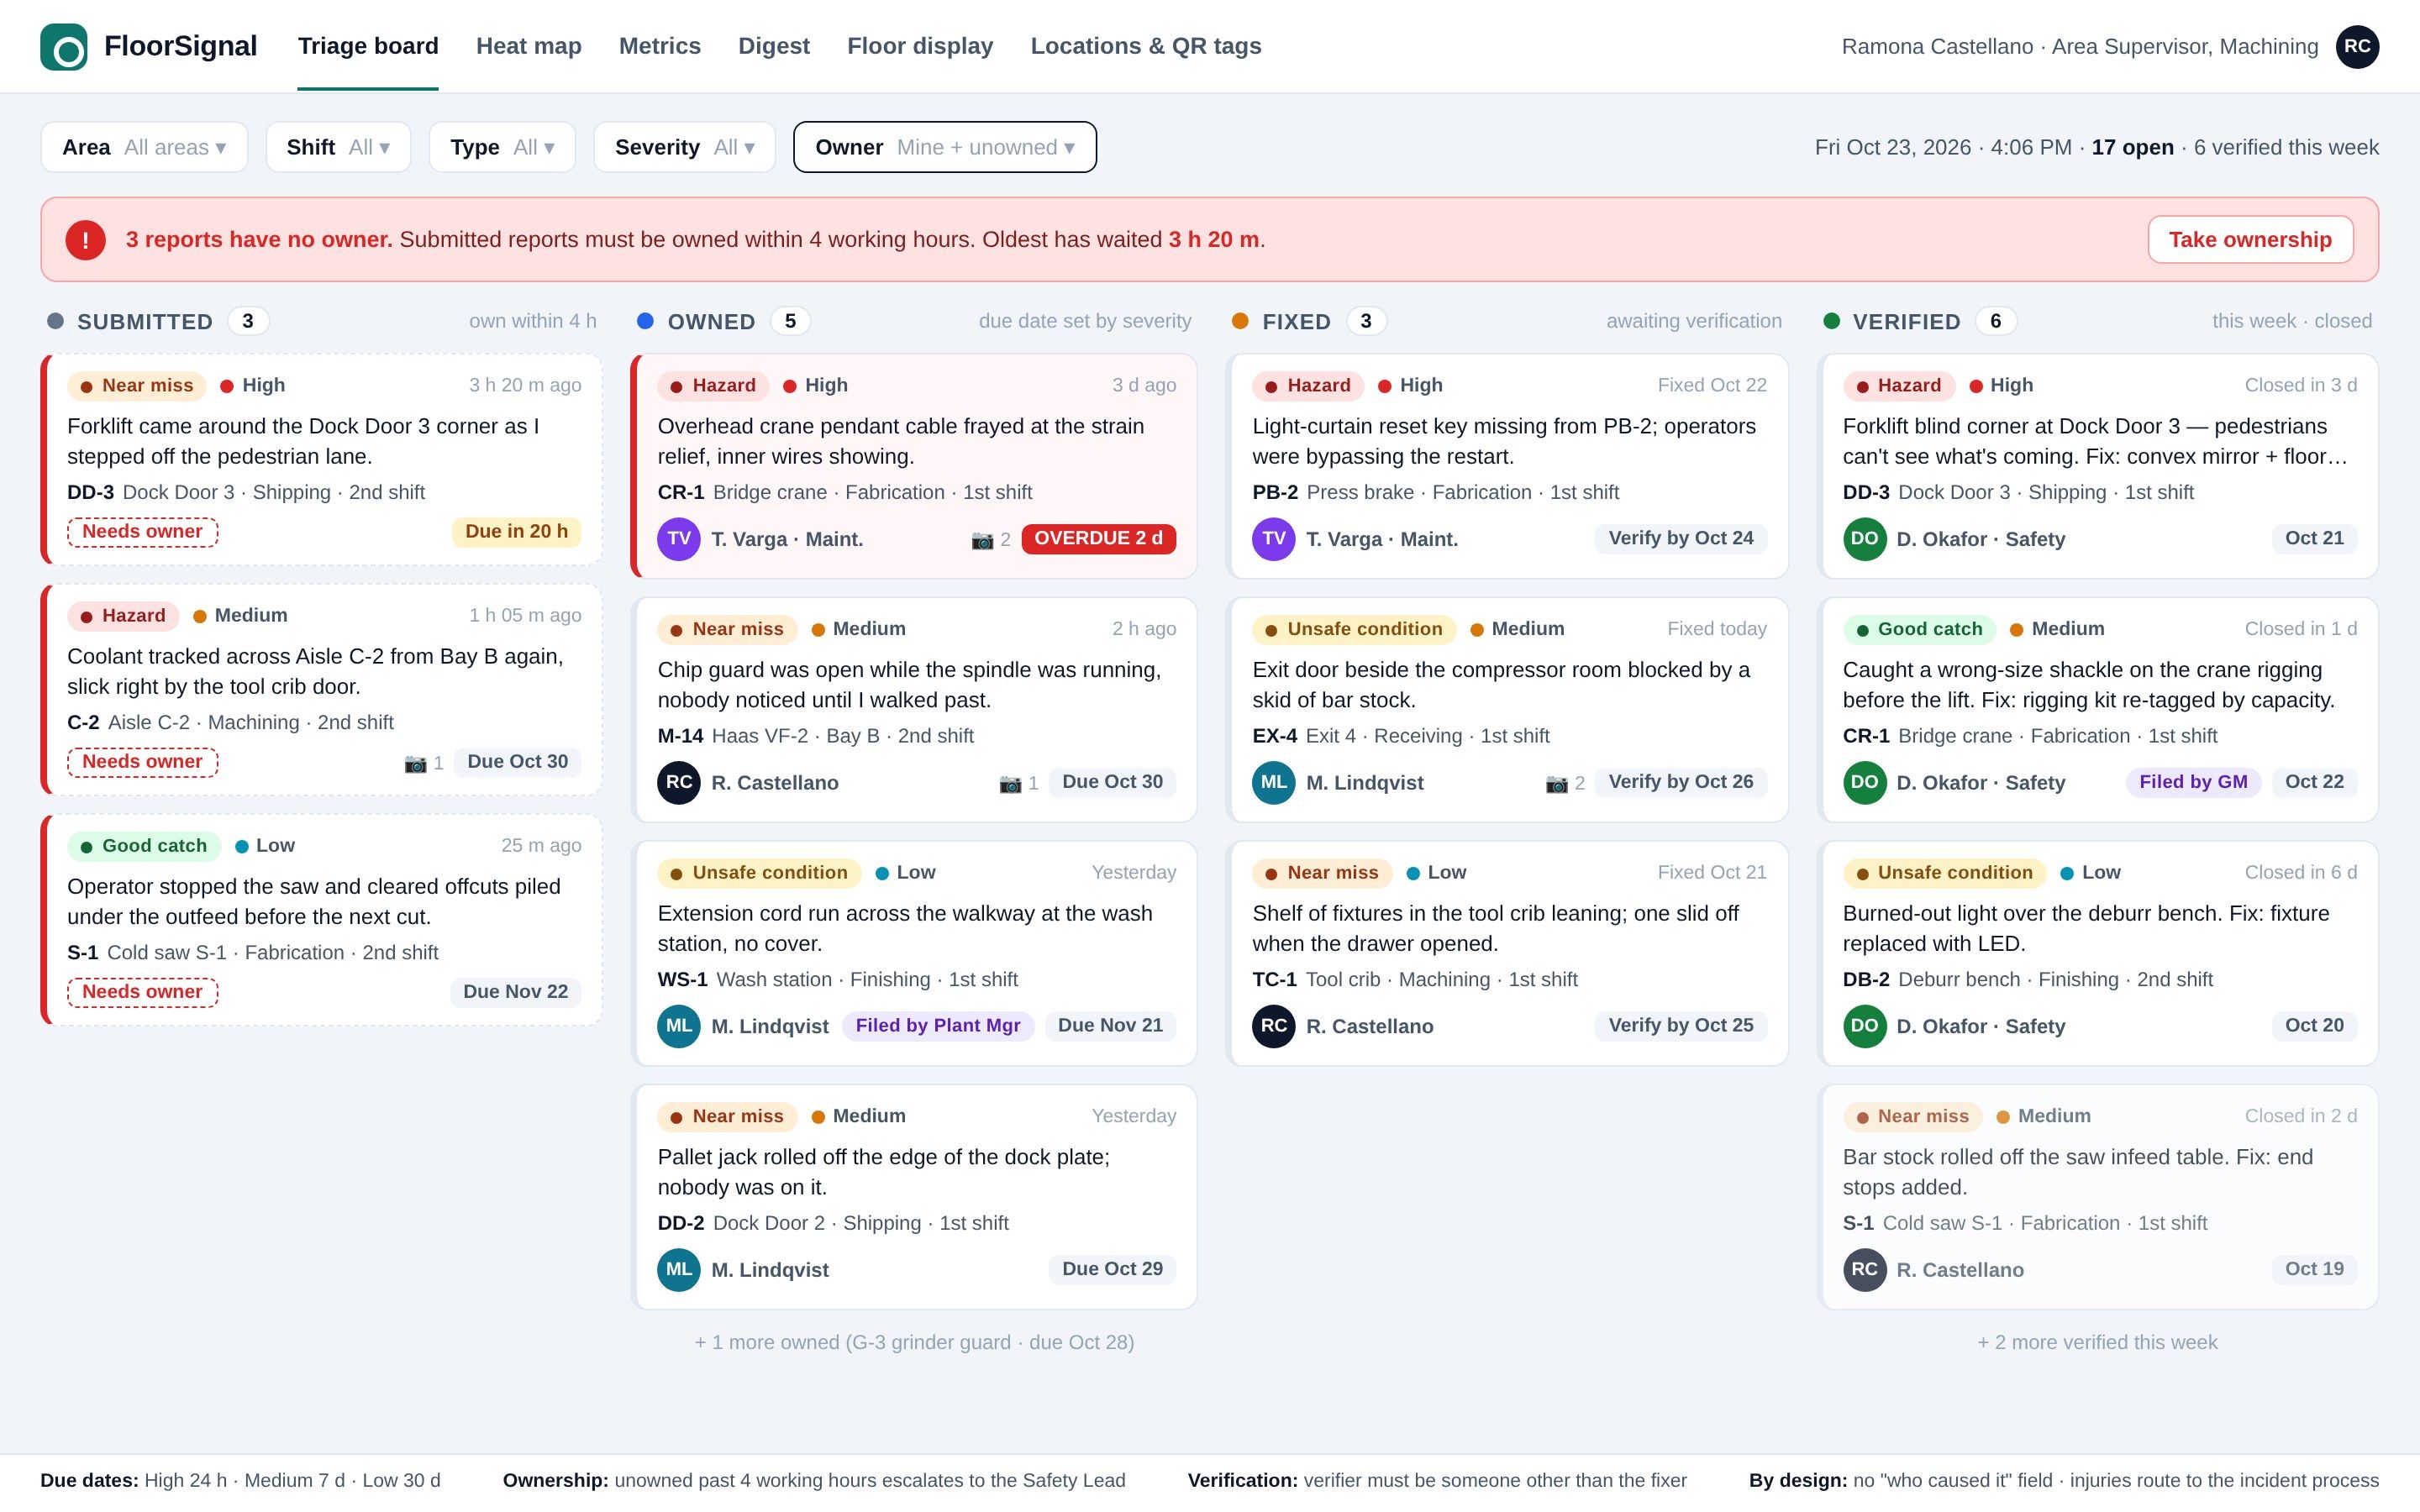
The report lands on a triage board for the area supervisor and the safety lead in four columns. Submitted must become Owned within four working hours; severity sets the due date to fix; overdue turns red; and Verified is confirmed by someone other than the fixer. A report with no owner sits in a banner at the top of the board until it has one. There is no field for who caused it. Trends are by area, shift, and hour, so the heat map shows the dock door at shift change rather than a person.
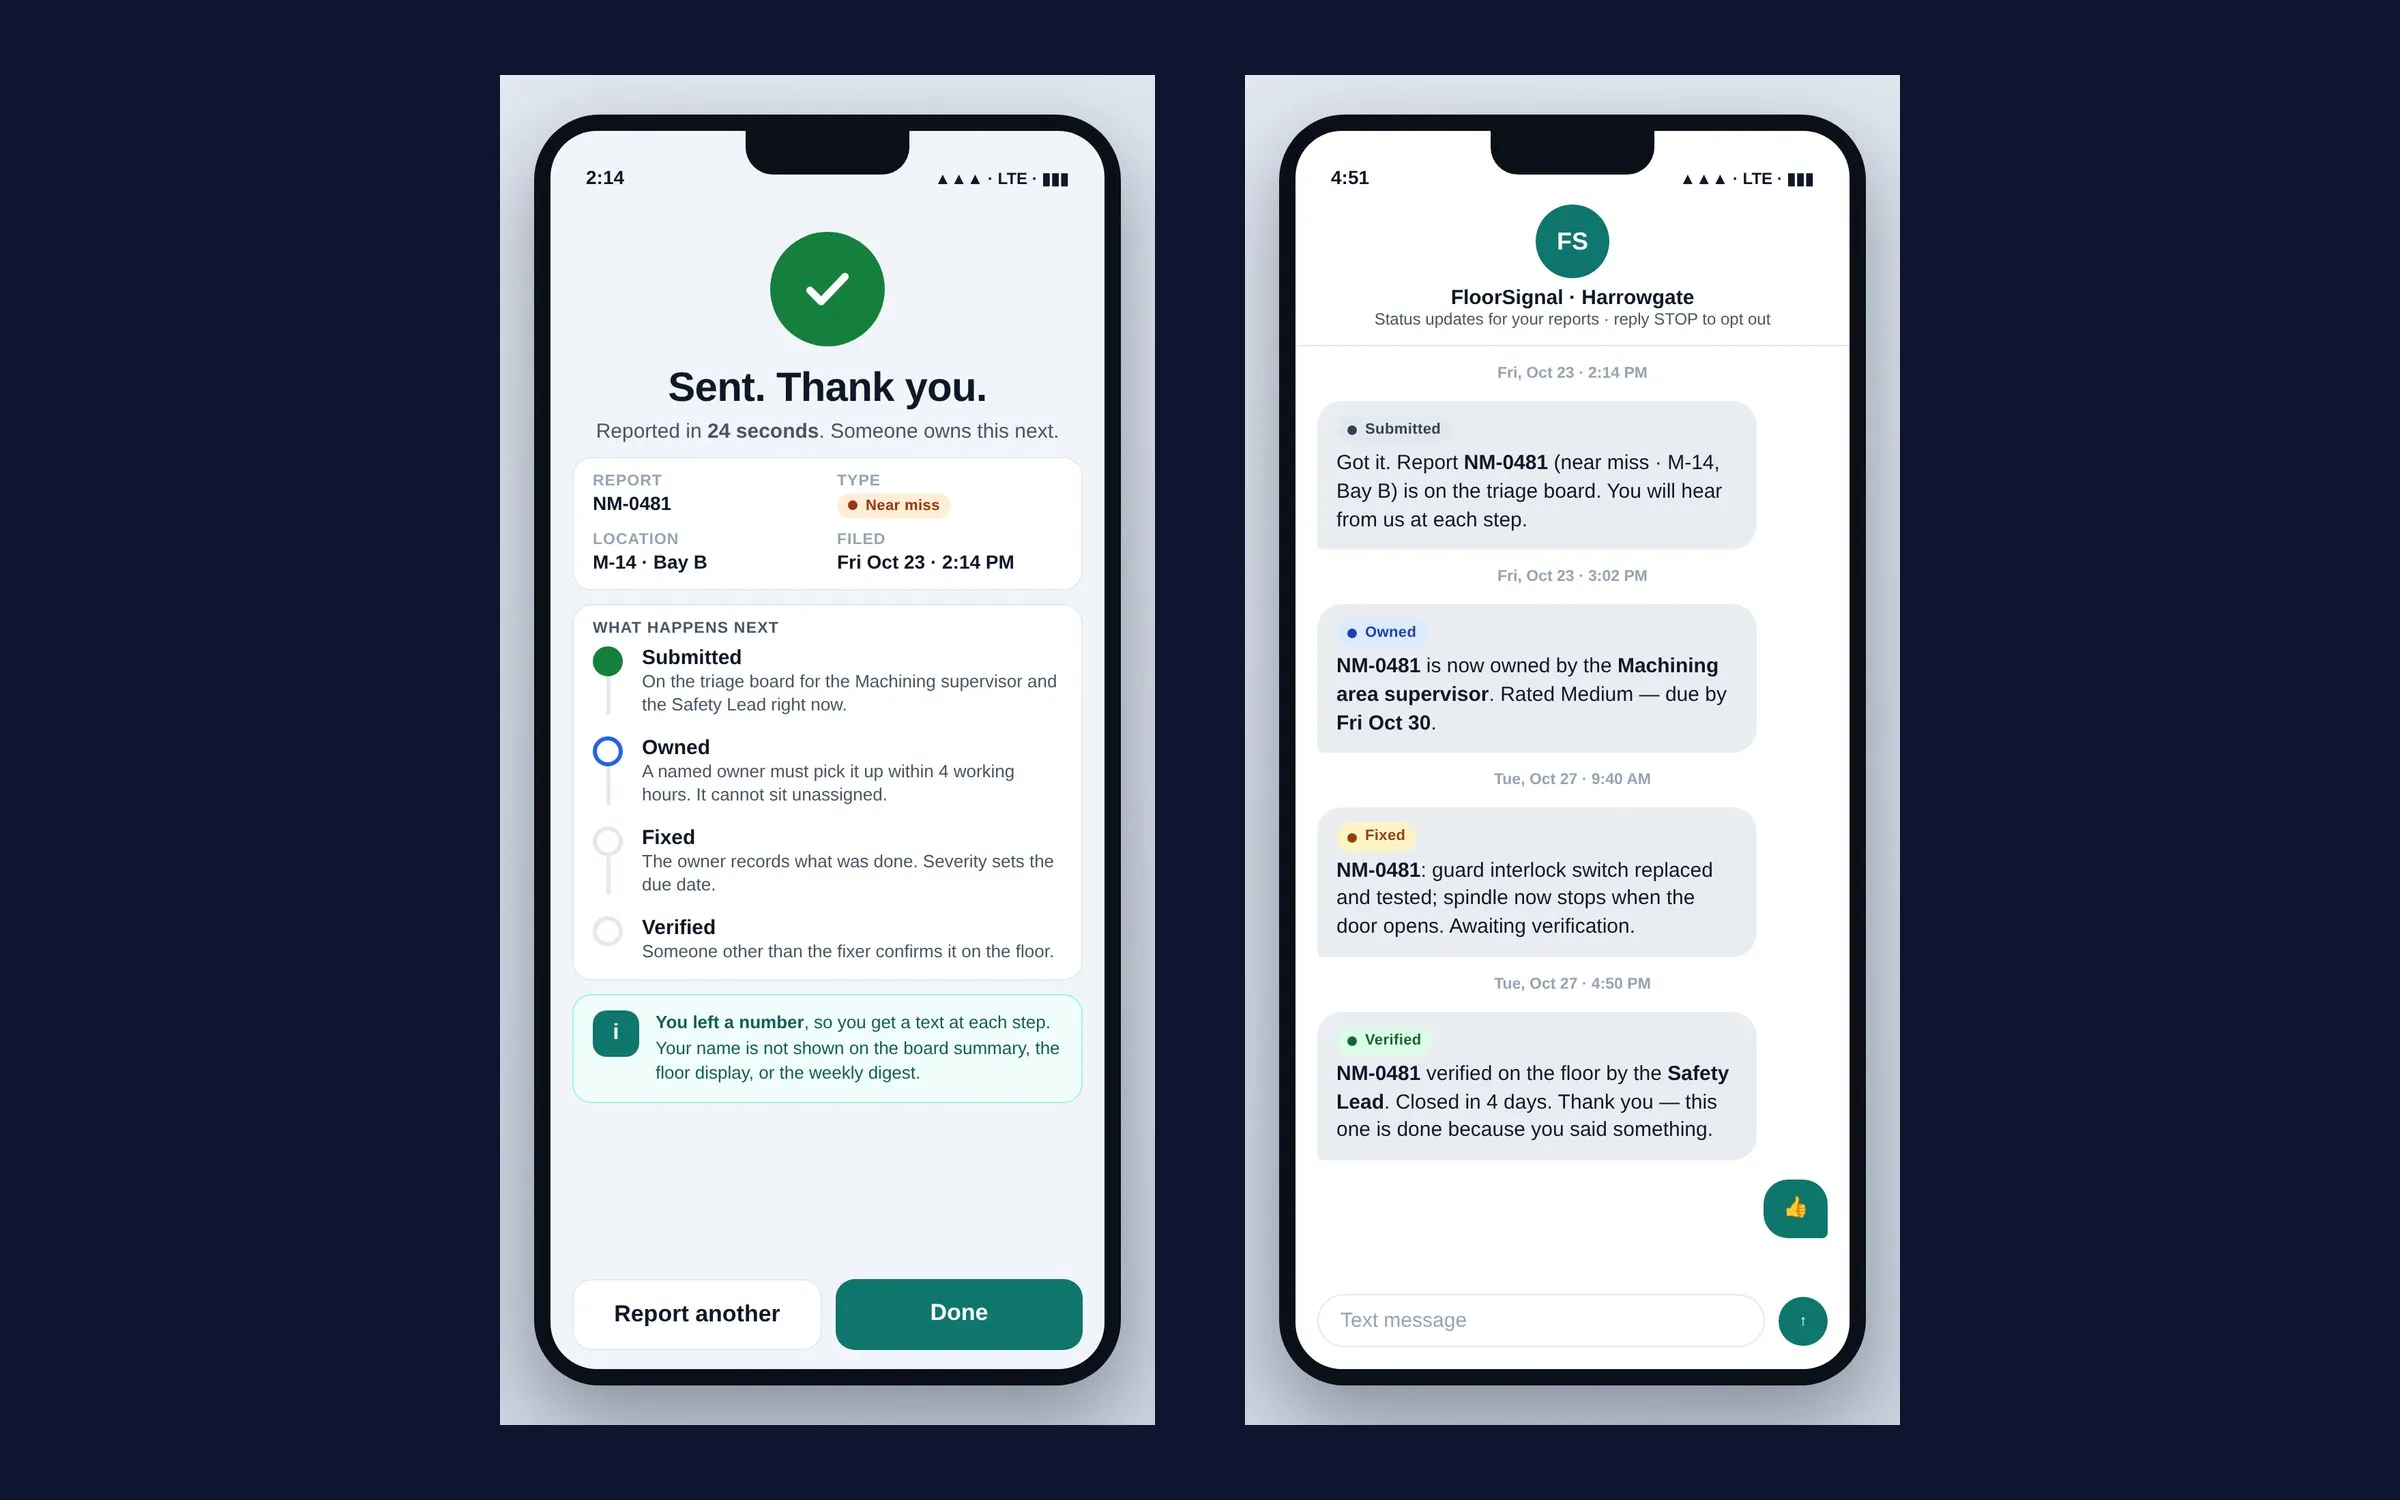
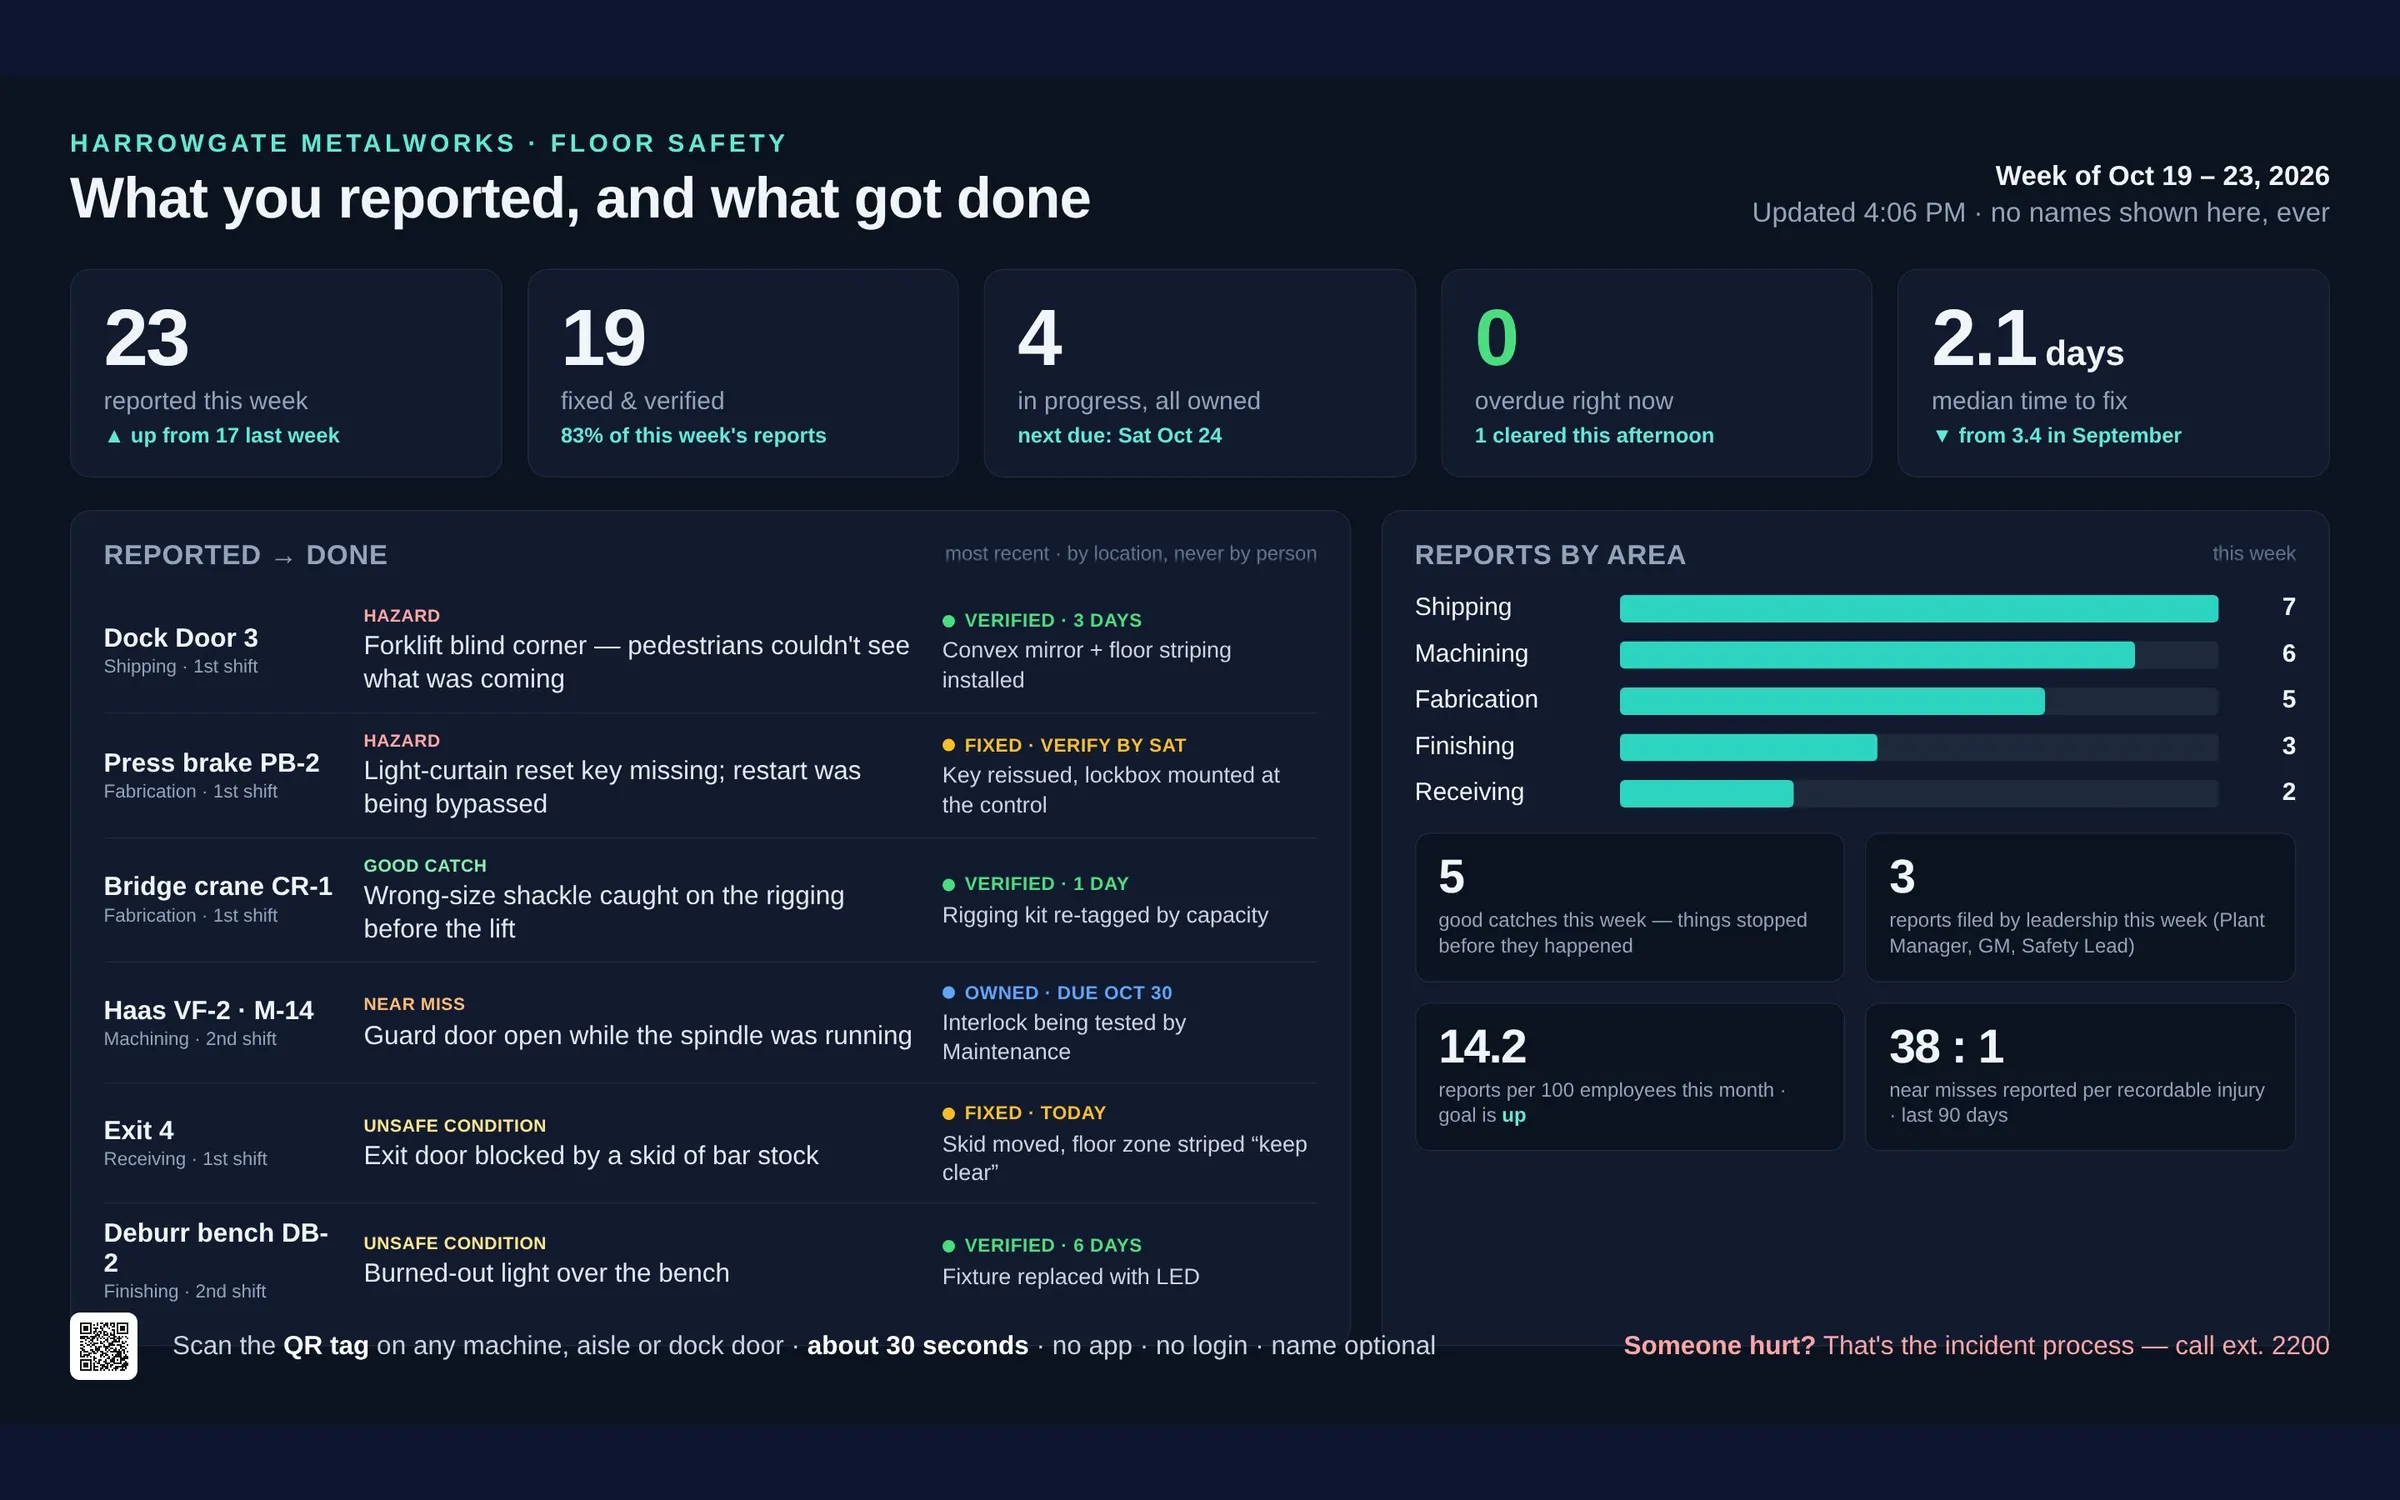
The loop closes in public. A floor display and a weekly digest list what was reported and what was done, with fixes named and reporters never named. A reporter who left a number gets a text at each state change. Leaders file reports too, and the board shows it.
Outcome
| Metric | Result |
|---|---|
| Status | Concept, in development |
| To report | Under 30 seconds, no app, no login |
| Ownership | A named owner within four working hours |
| States | Submitted, Owned, Fixed, Verified |
Built to move five numbers, each computed from the tool’s own records.
Reports per hundred employees per month should rise, because underreporting is the problem being solved. Median days to close and the share closed within thirty days are the speed of the loop. Repeat hazards per area should fall as the heat map does its work. The ratio of near misses reported to recordable incidents is the honest leading indicator, and the recordable rate and severity are the lagging ones, read quarterly.
Nothing here has run on a floor yet. The screens are a specification with fictional data, and the numbers on them are placeholders.
Gallery
-
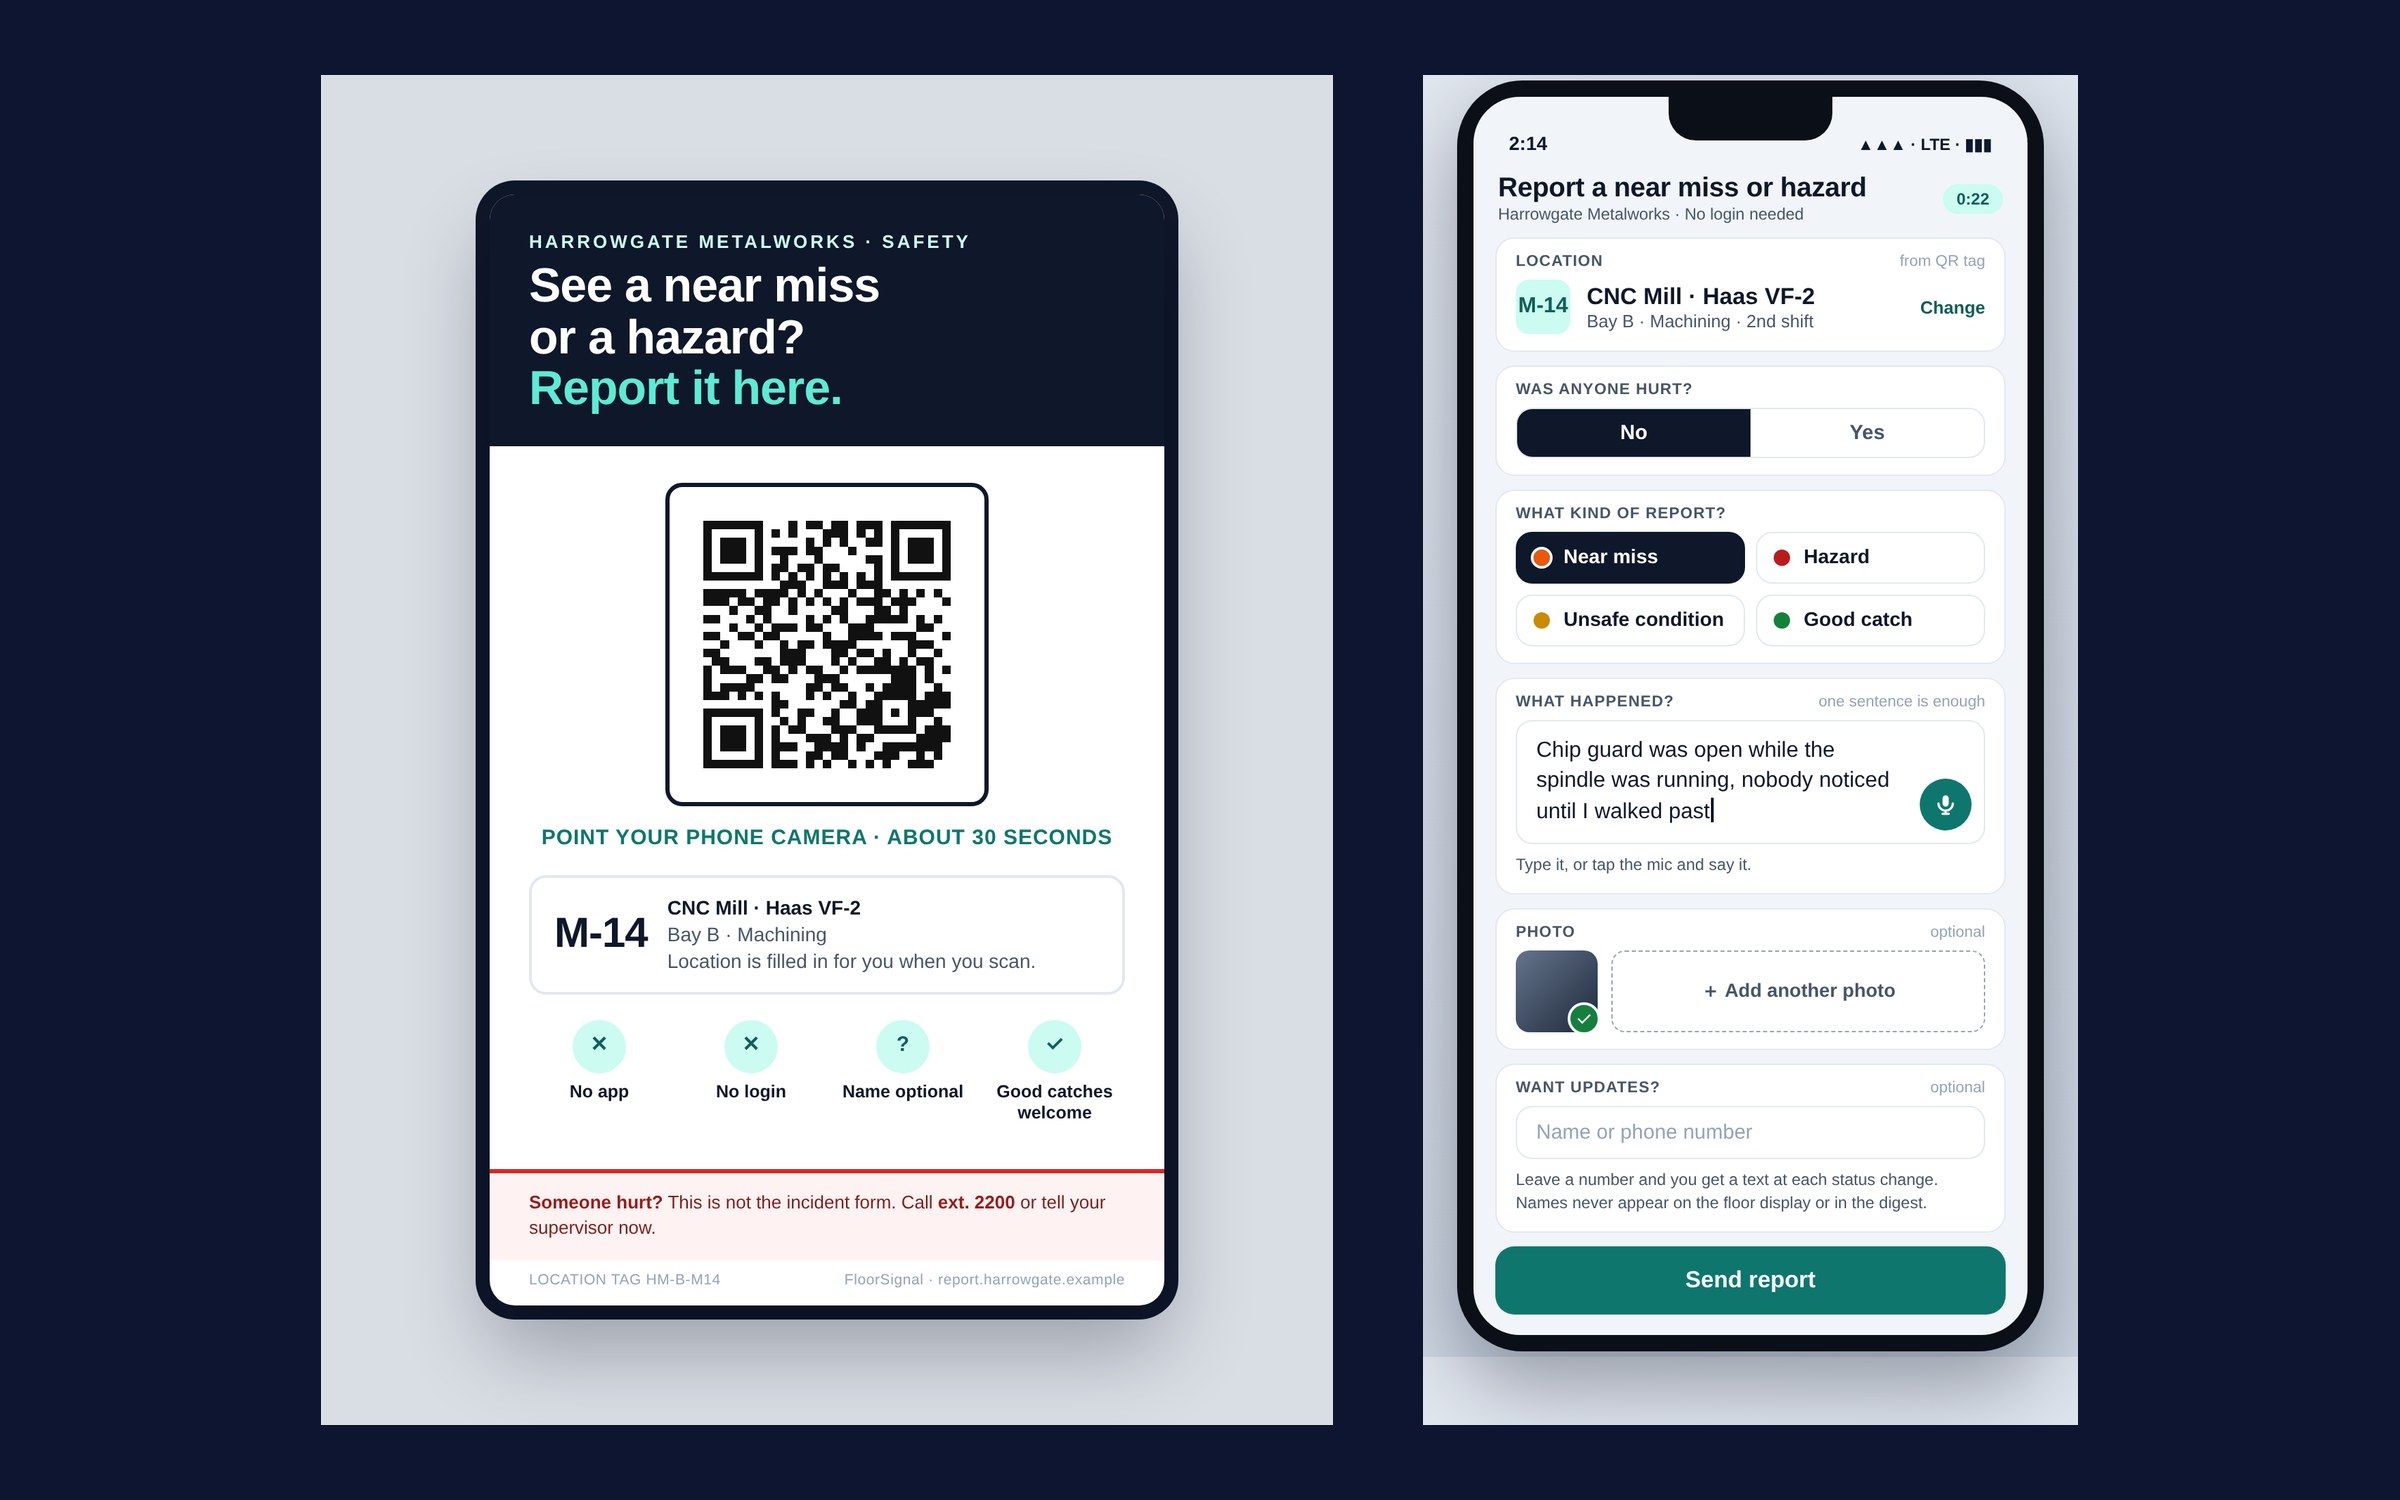
4.0 Scan the tag at the machine, pick a type, say what you saw, add a photo. The location is already filled in. Image -
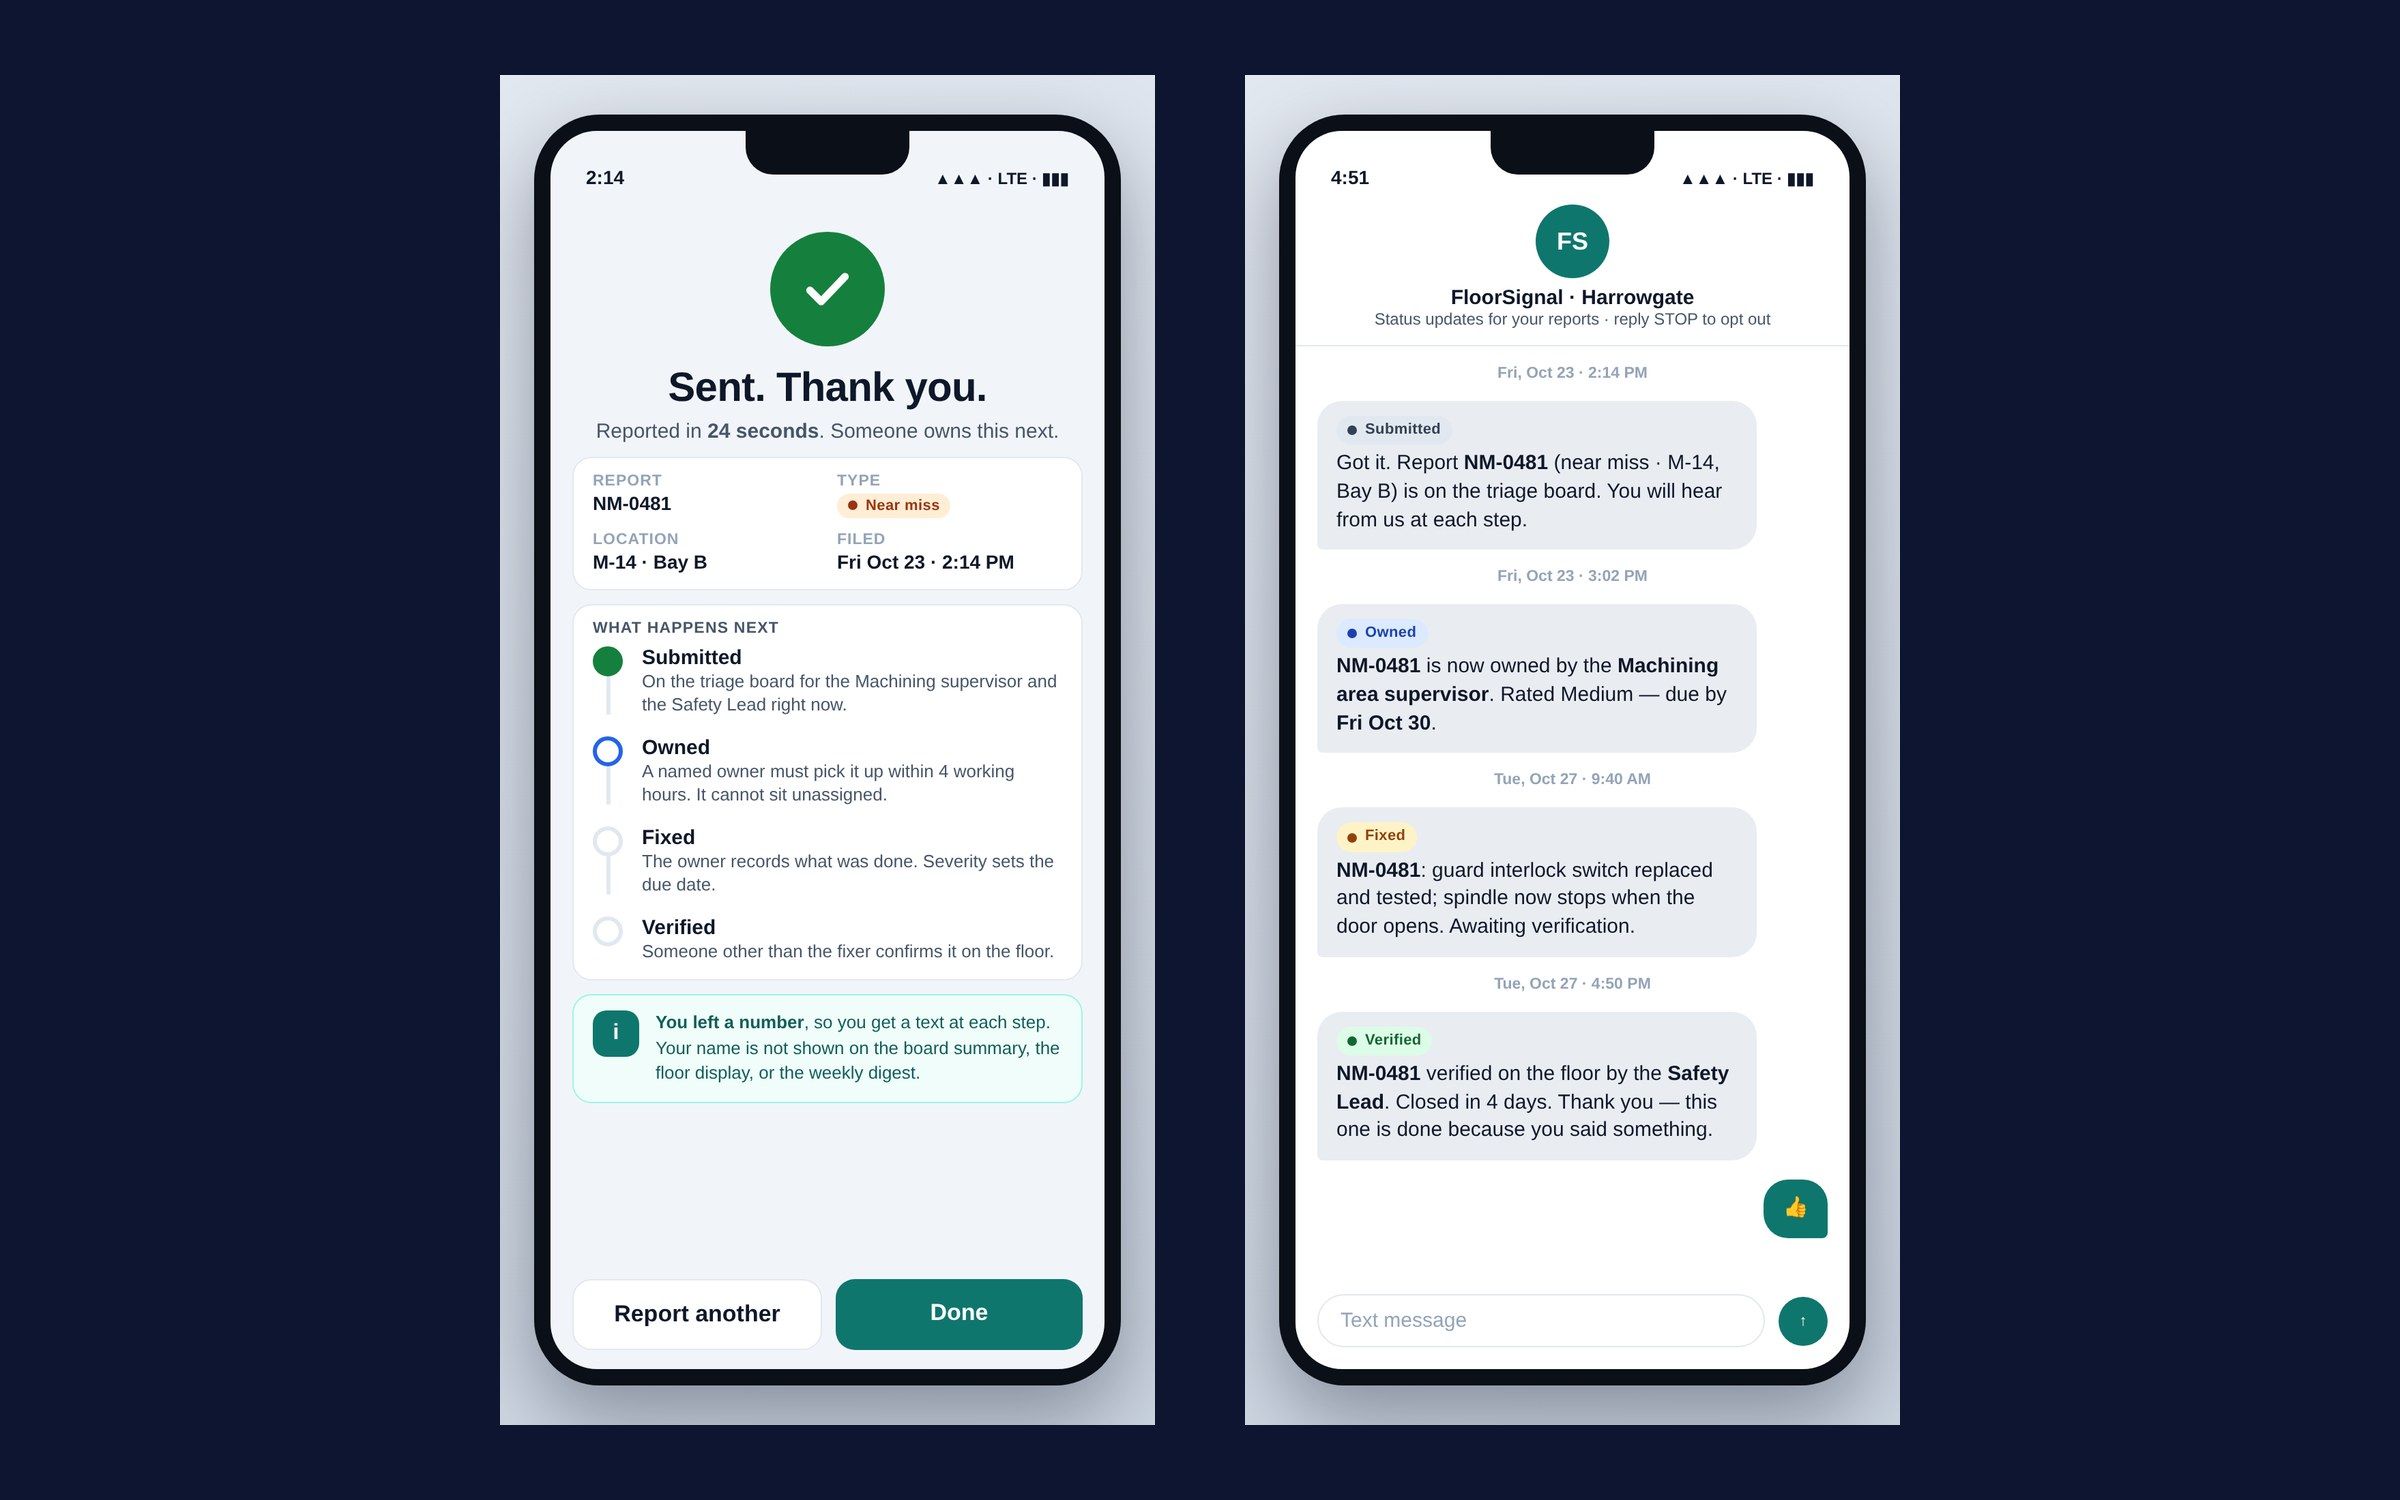
4.1 A reporter who leaves a number hears at every step. Nobody else ever sees their name. Image -
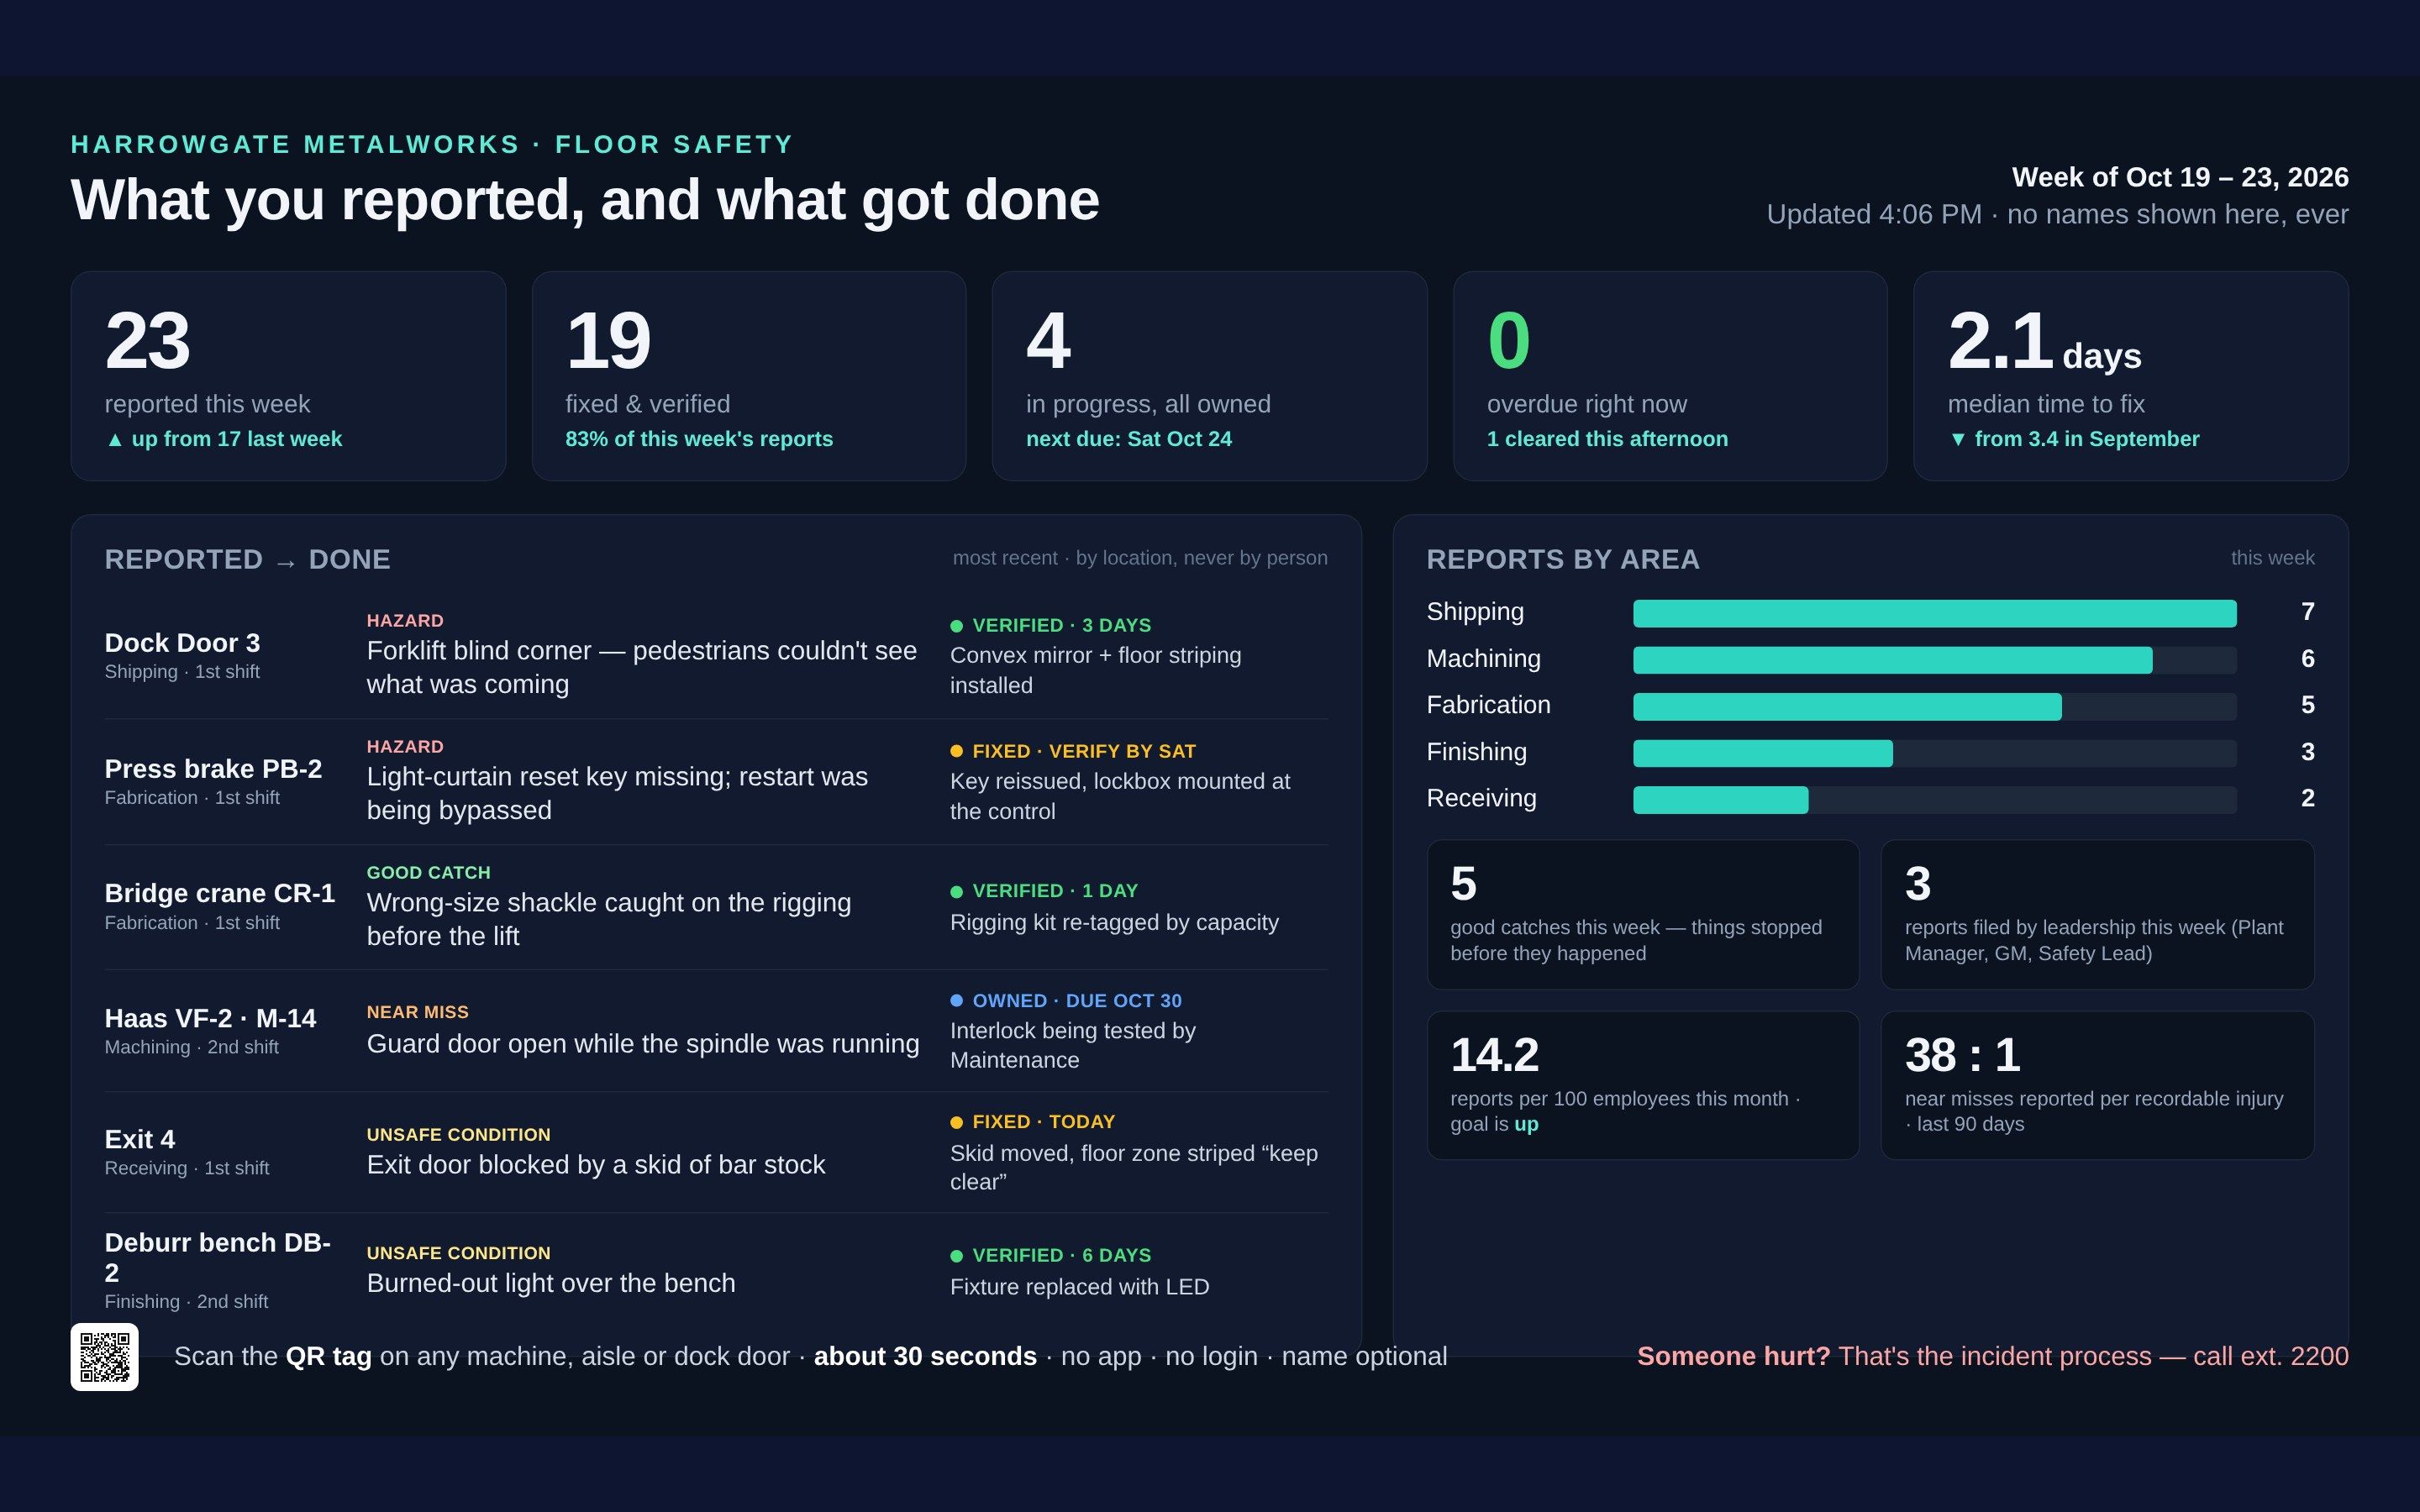
4.2 What you reported, and what got done, on the floor TV. No names, every fix. Image -
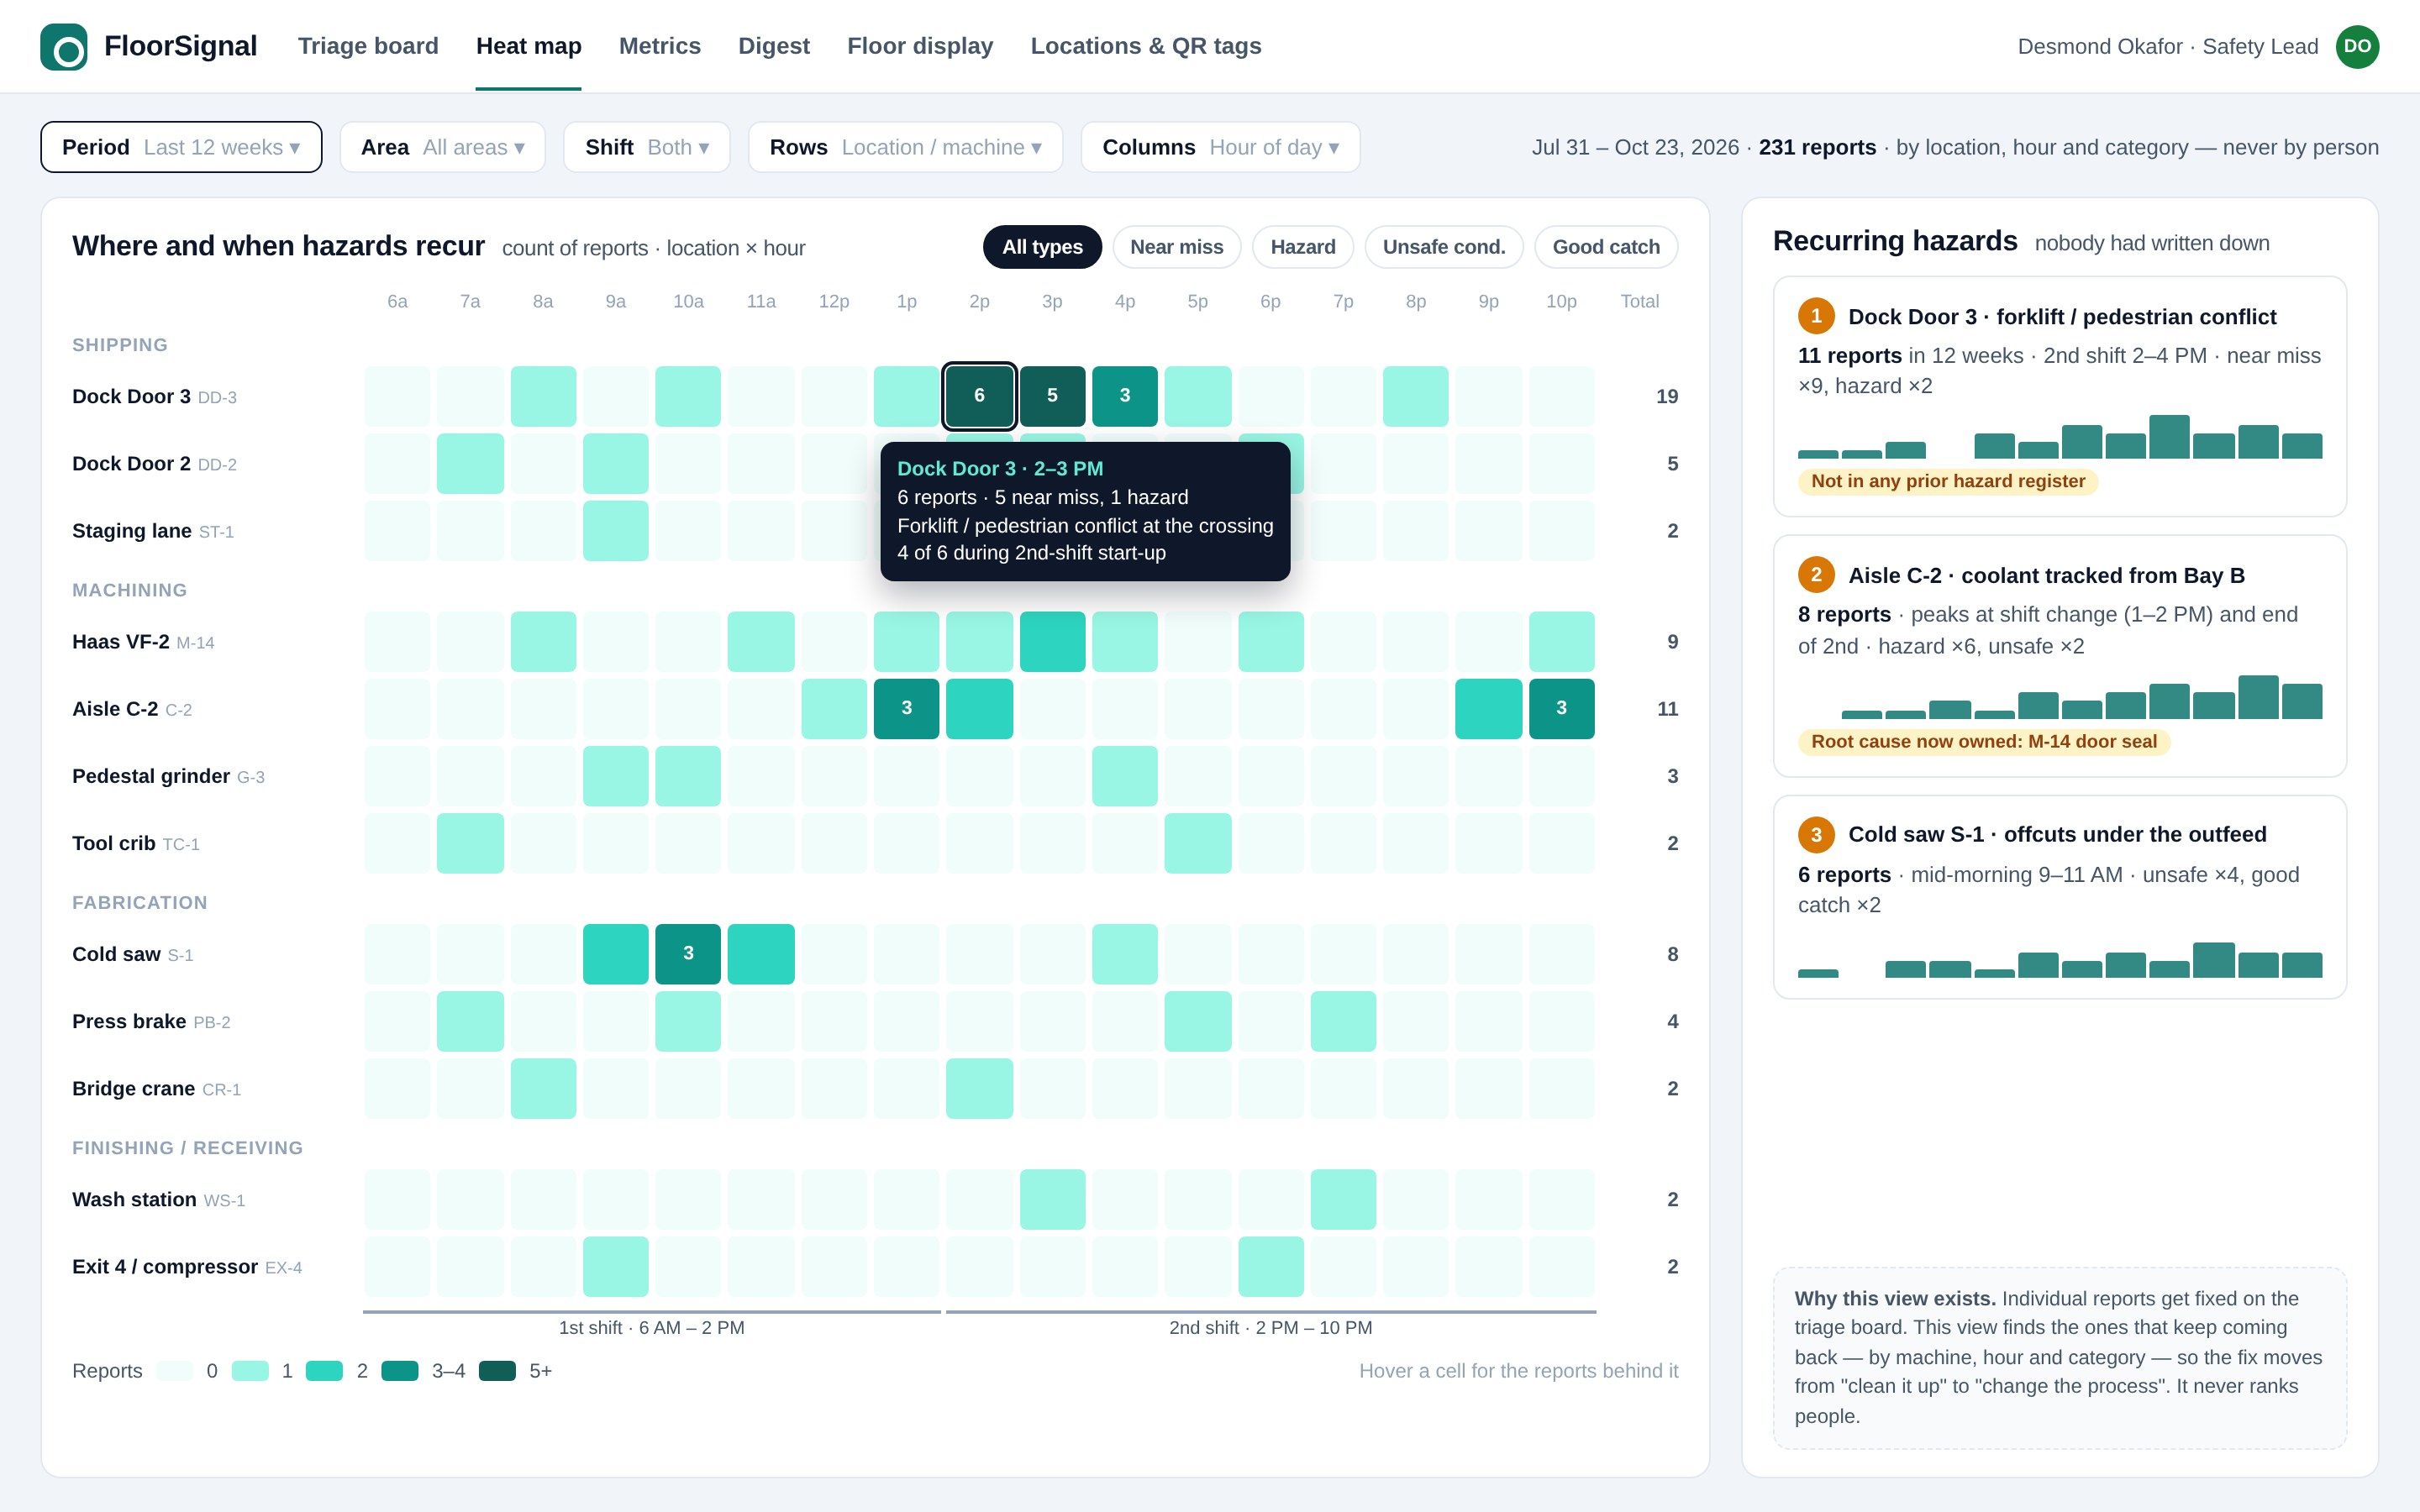
4.3 Where and when hazards recur. The dock door at shift change stops being a surprise. Image -
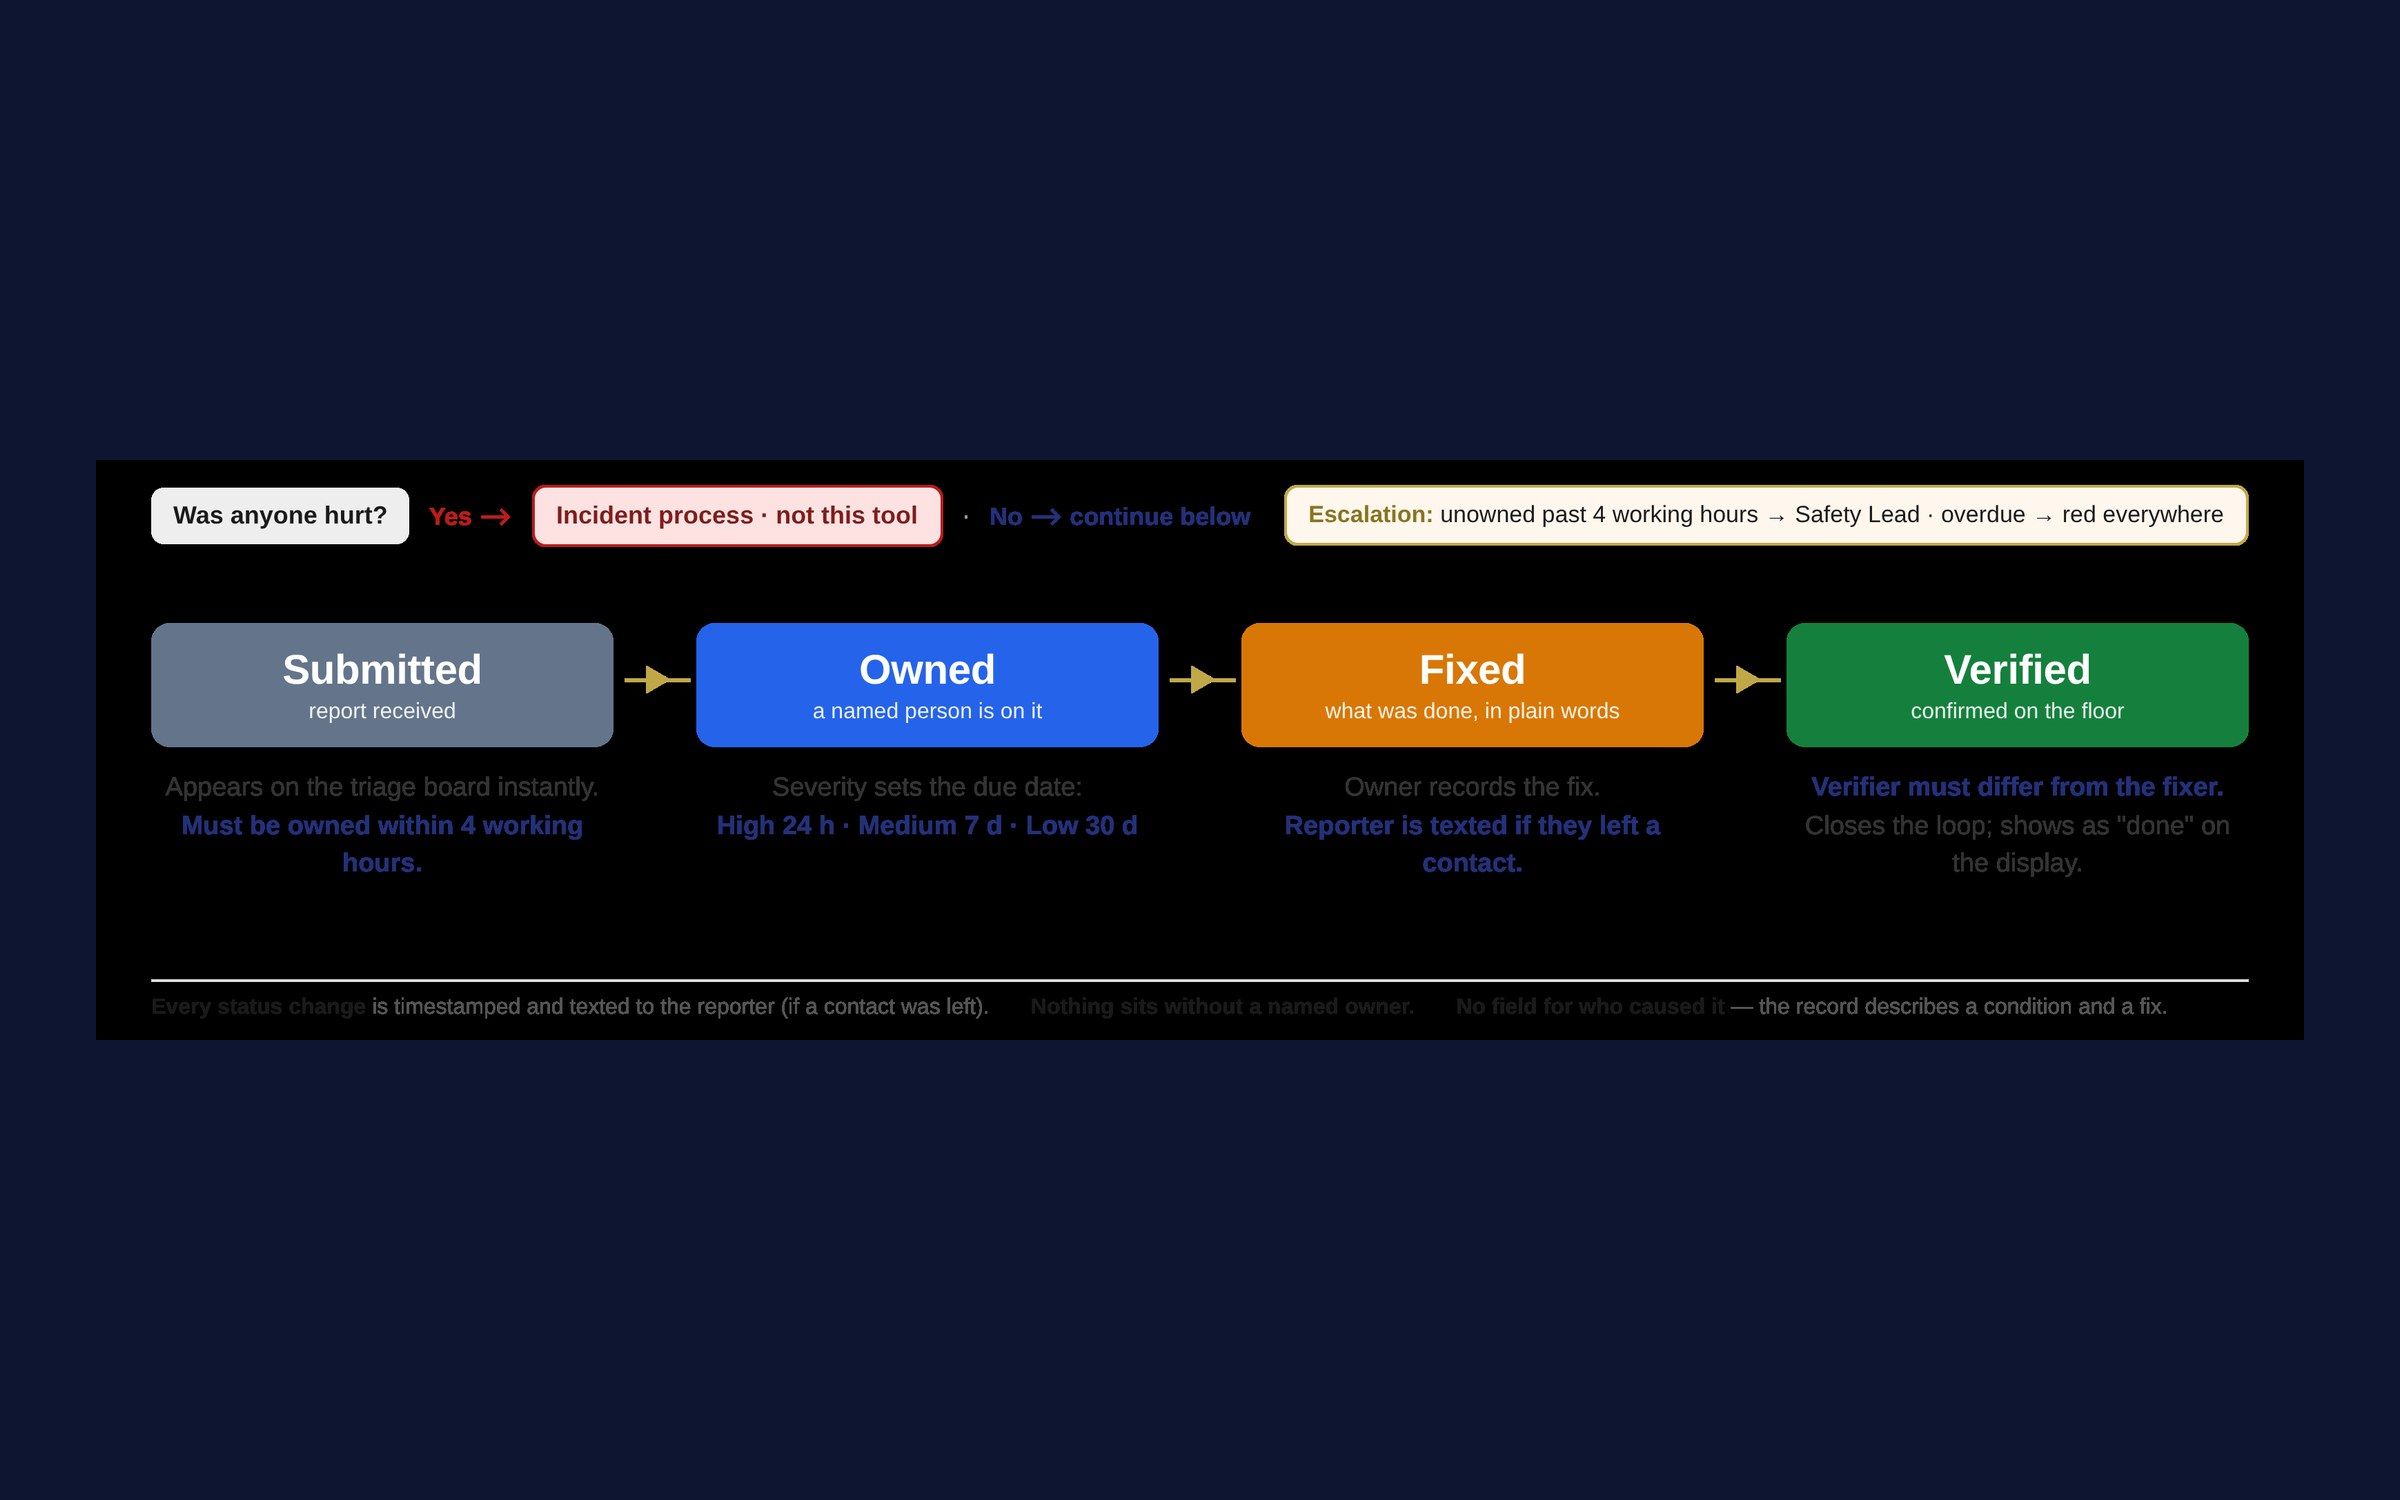
4.4 Four states, each with a rule. Injuries go to the incident process, not to this tool. Image